Weather Academy & Glossary
A weather school that
lives inside the forecast.
Most apps assume you already know what a dew point is, or assume you never will. Sensecast takes a third position: every number on the screen can explain itself, at whatever depth you want, the moment you are curious. Then it gets out of the way.
How an explanation is built
Analogy first. Physics last.
Tap the information button on any metric and a sheet opens with the same three layers every time. You can stop after the first one and still have learned something true.
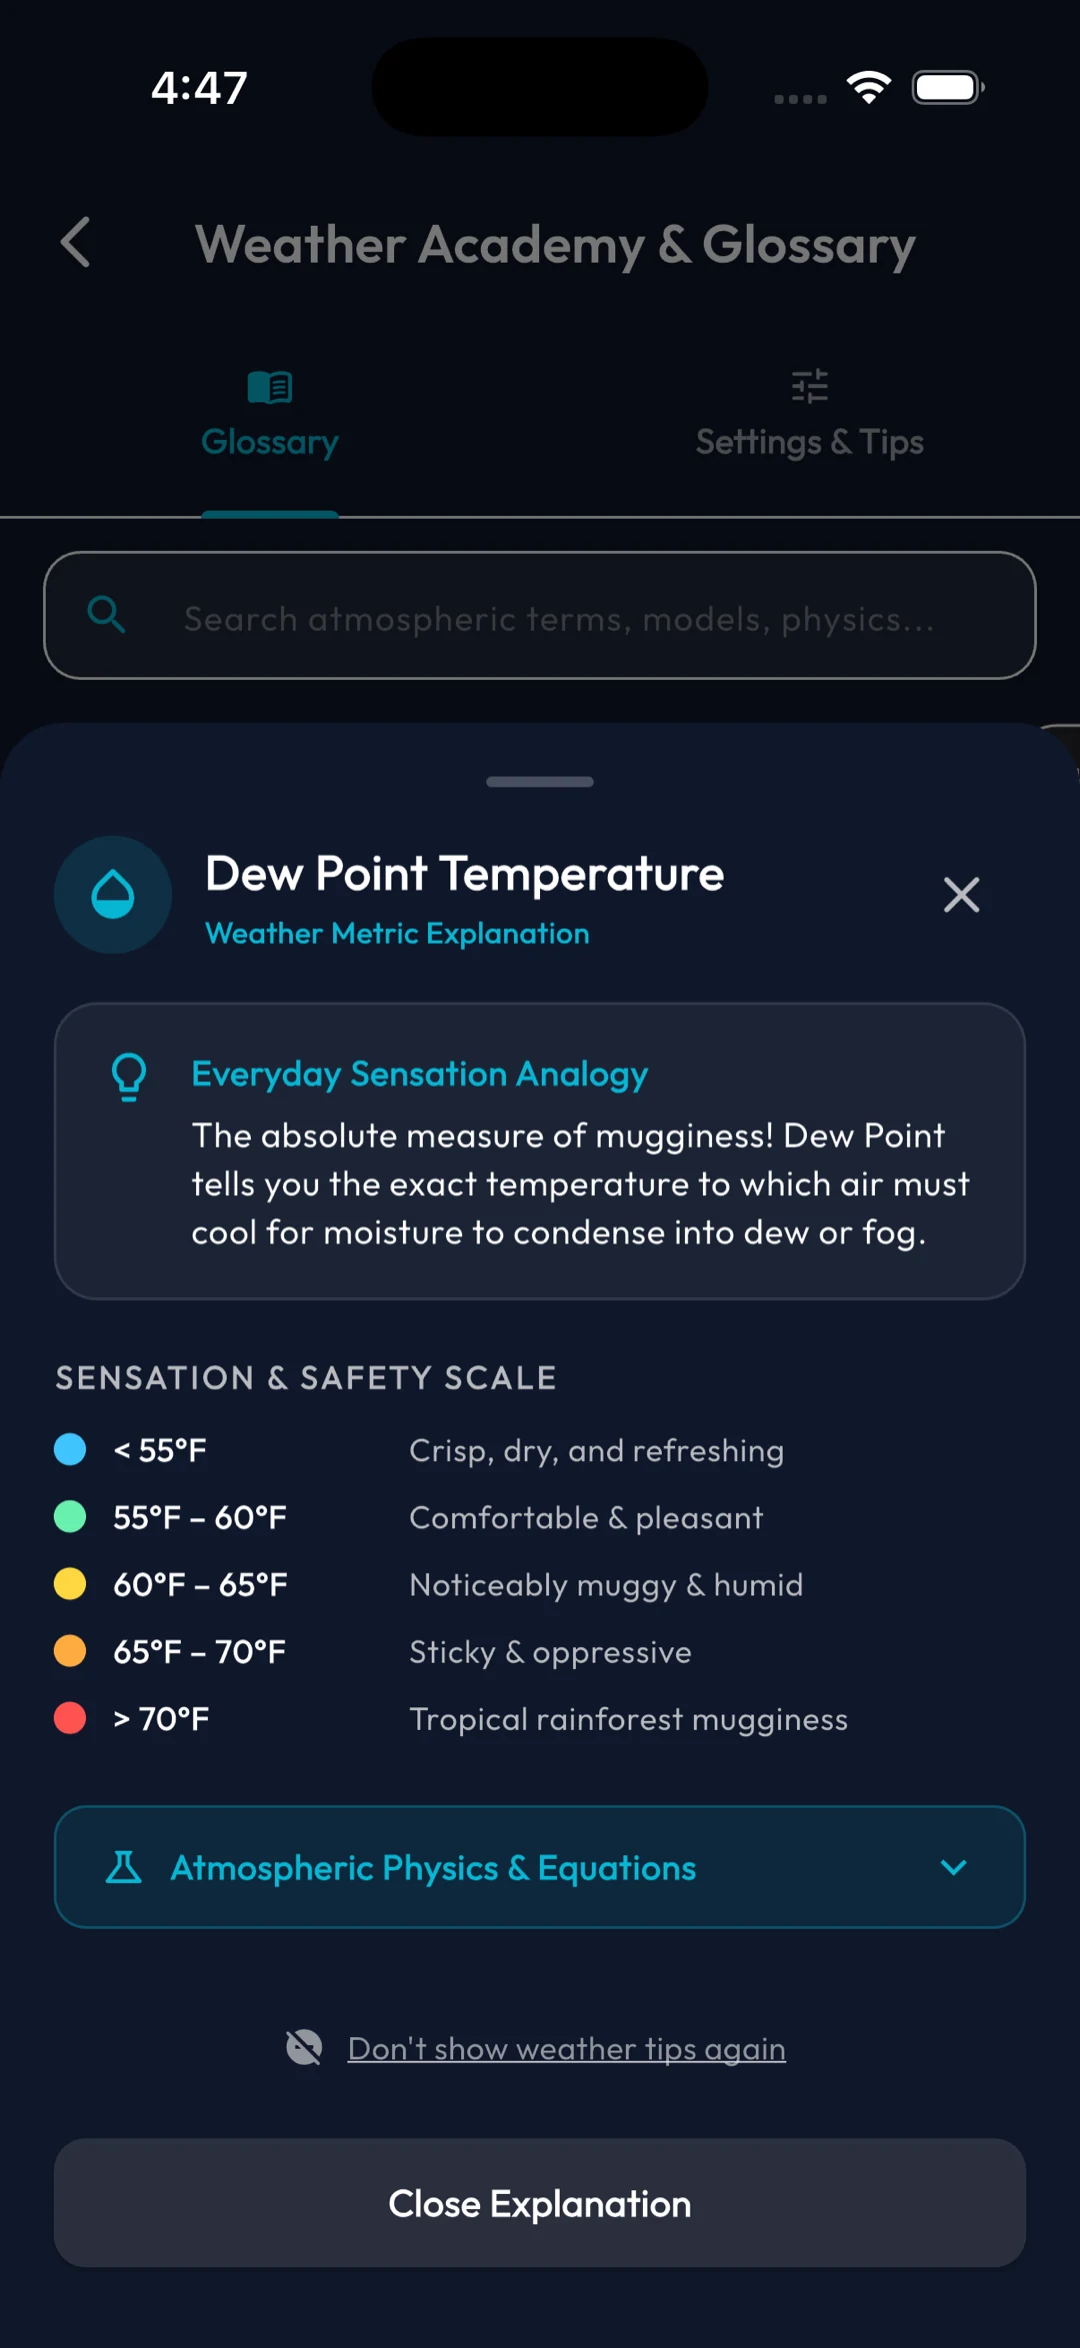
Dew point, as the app explains it
The analogy sits at the top where it cannot be missed, the banded scale gives the reading somewhere to stand, and the physics stays collapsed until you ask for it. The three cards below take that sheet apart.
Layer one
Everyday sensation analogy
What this number feels like on skin, in a sentence, with no jargon and no equation.
Layer two
Sensation & safety scale
Where today's reading sits on a banded scale, so the number has somewhere to stand.
Layer three
Atmospheric physics & equations
An expandable section with the real mechanism — for when the analogy is not enough.
The catalogue
Twenty-seven topics,
four categories, one search box.
The Academy is a screen of its own, not just a set of tooltips. Search atmospheric terms, models and physics, or filter by category and read straight through.
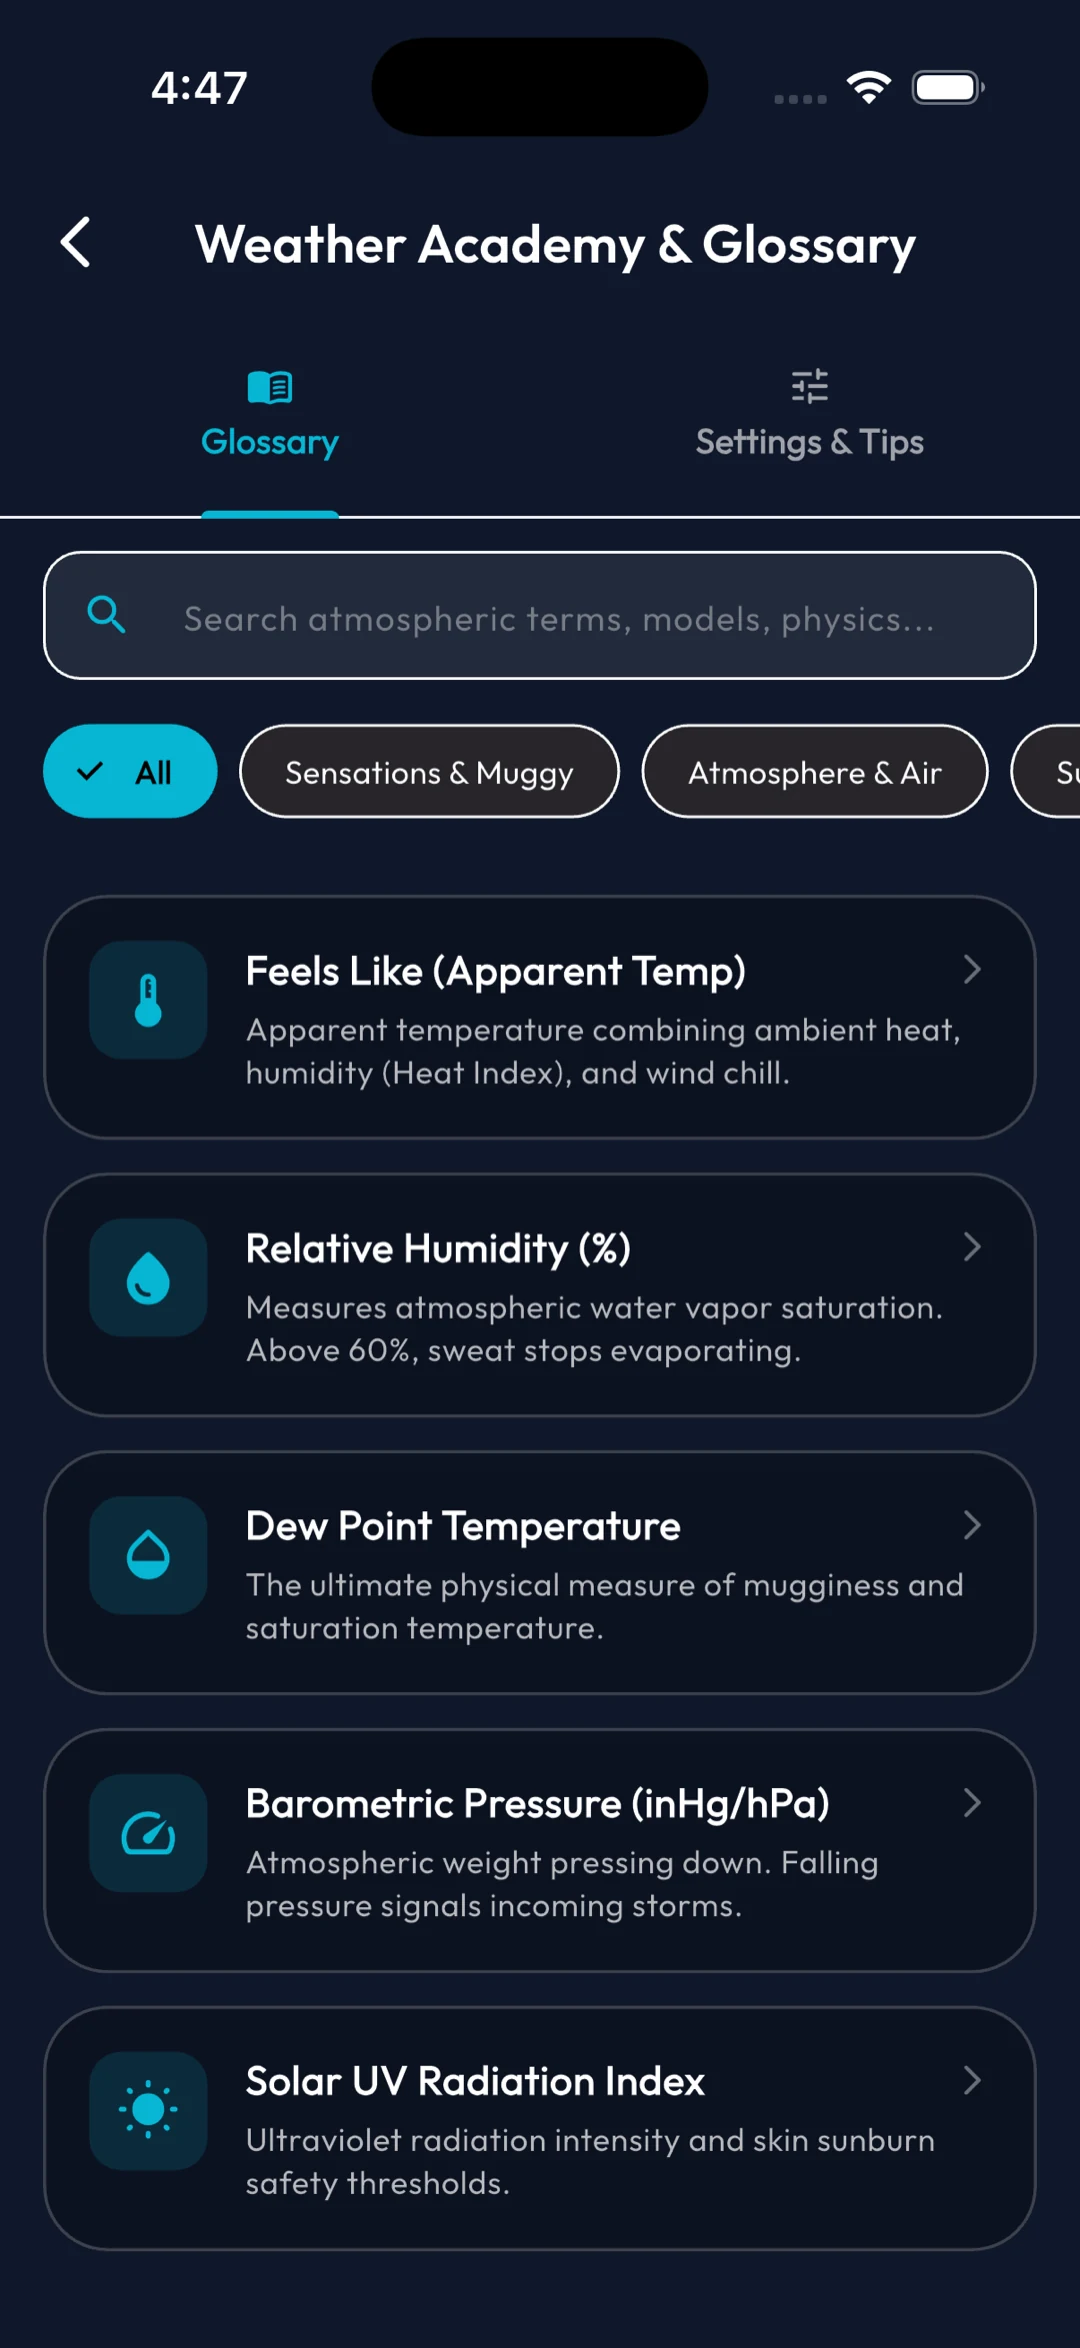
The real screen
Search runs over terms, models and physics at once. The chips filter to a category, and every row opens the three-layer sheet.
Below is the same catalogue, filterable here on the page.
In the flow of use
Where the tips show up.
Contextual buttons sit on the cards themselves, so the explanation arrives at the moment the question does. A master switch in settings turns the whole layer off once you no longer need it.
Current conditions detail
Dew point, pressure, UV index, wind gusts, POP%, cloud cover and the sun arc each open to real-world physical meanings.
Air quality and pollen cards
EPA health thresholds, PM2.5 particle-size analogies, and tree, grass and ragweed peak seasons.
Aurora and geomagnetism
The Kp scale from 0 to 9, coronal mass ejections, and which latitudes actually get a view tonight.
Doppler reflectivity
How to read decibels of reflectivity, and what separates a light drizzle echo from a hail signature.
Numerical weather prediction
How ECMWF IFS, NOAA GFS, HRRR, DWD ICON and Canada GEM actually compute fluid dynamics over a grid.
Power outages and reliability
How storms, ice loading, tree limb contact and grid surges turn into an interruption at your address.
Free, all of it
The academy is not
behind the paywall.
All 27 topics, every tap-to-learn sheet and the full glossary ship with the free app. Learning the atmosphere should not be the upsell.
Built on published science
Explanations draw on the Steadman apparent temperature model, the Rothfusz heat index regression, Rayleigh scattering, EPA AQI breakpoints and NOAA Storm Prediction Center climatology — cited in the app, not paraphrased from a blog.