A weather app iOS in beta Android in beta macOS coming soon Web coming soon
Most weather apps
tell you what.
This one tells you why.
Sensecast reads the weather the way a meteorologist would and then explains it the way a person would. It routes to the agency that actually models your terrain, every number on the screen can teach you what it means, and live tornado and power-grid warnings run underneath the forecast.
Free to useNo accountNo ads42 sources free
What it actually is
Three things you won't
find in a weather app.
The provider count gets the attention, but it is the smallest part of the story. Sensecast is built around teaching you the atmosphere, watching the hazards that actually reach your house, and refusing to pretend a forecast is a single number.
A weather school inside the forecast
Every metric on the dashboard carries an information button. Tap it and you get the sensation analogy first, the safety scale second, and the actual physics third — as deep as you want to go.
- 27-topic searchable glossary across four categories
- Plain-language analogies before any equation
- Steadman, Rothfusz, Rayleigh scattering and EPA breakpoints for the curious
- Tooltips switch off entirely once you know it
Weather Academy & GlossarySensations & Muggy · Atmosphere & Air · Sun, Solar & Space · Supercomputers & Radar
Hazards that reach your house
Live tornado touchdowns from the Storm Prediction Center, county-level power outages from federal open data, and a grid stress score that rises before the lights go out.
- Tornado & convective tracker on live NOAA SPC reports
- Grid Vulnerability Index from gusts, ice loading and thermal demand
- Local utility directory with one-tap outage hotlines
- Certified storm reports you can hand to an insurer
Live federal open dataNOAA SPC · ODIN (Oak Ridge National Laboratory) · U.S. Department of Energy · U.S. Energy Information Administration
The agency that knows your terrain
Rather than pushing one global model everywhere, smart routing detects your location and hands off to the service that actually models it — NOAA and the NWS across the US, MET Norway for fjords, HKO for typhoons, Météo-France's 1.3 km AROME grid for Western Europe.
- Automatic by default; override it whenever you like
- 42 agencies free; 8 flagship supercomputers with Pro
- Compare any of them side by side when you want a second opinion
- Bring your own key for OpenWeatherMap or WeatherAPI
SourcesECMWF IFS · NOAA GFS & HRRR · DWD ICON · ECCC GEM · UKMO · JMA · Météo-France AROME · +43 more
An example
Dew point, the way Sensecast explains it.
Relative humidity moves with the temperature and tells you almost nothing on its own. Dew point holds still. This is the exact scale the app shows when you tap the information button on that tile.
And the rest of it
Built for people who
actually look outside.
The background is the forecast
A physics-driven canvas renders the current condition — raindrops with splash rings, drifting cloud layers, snow, fog, lightning, starfields — and follows the solar arc from your coordinates through dawn, day, sunset and night.
50 minutes back, 18 hours forward
Scrub live reflectivity with a play head and a dBZ legend running light drizzle through hail, over CartoDB Dark Matter basemaps. Past, live, +2h and +18h model nowcasts in one control.
Alerts your body already knows
Push notifications when barometric pressure drops 3 hPa or more in three hours — the threshold that alters sinus and inner-ear pressure and sets off migraines and arthritic joint pain.
Certified storm verification
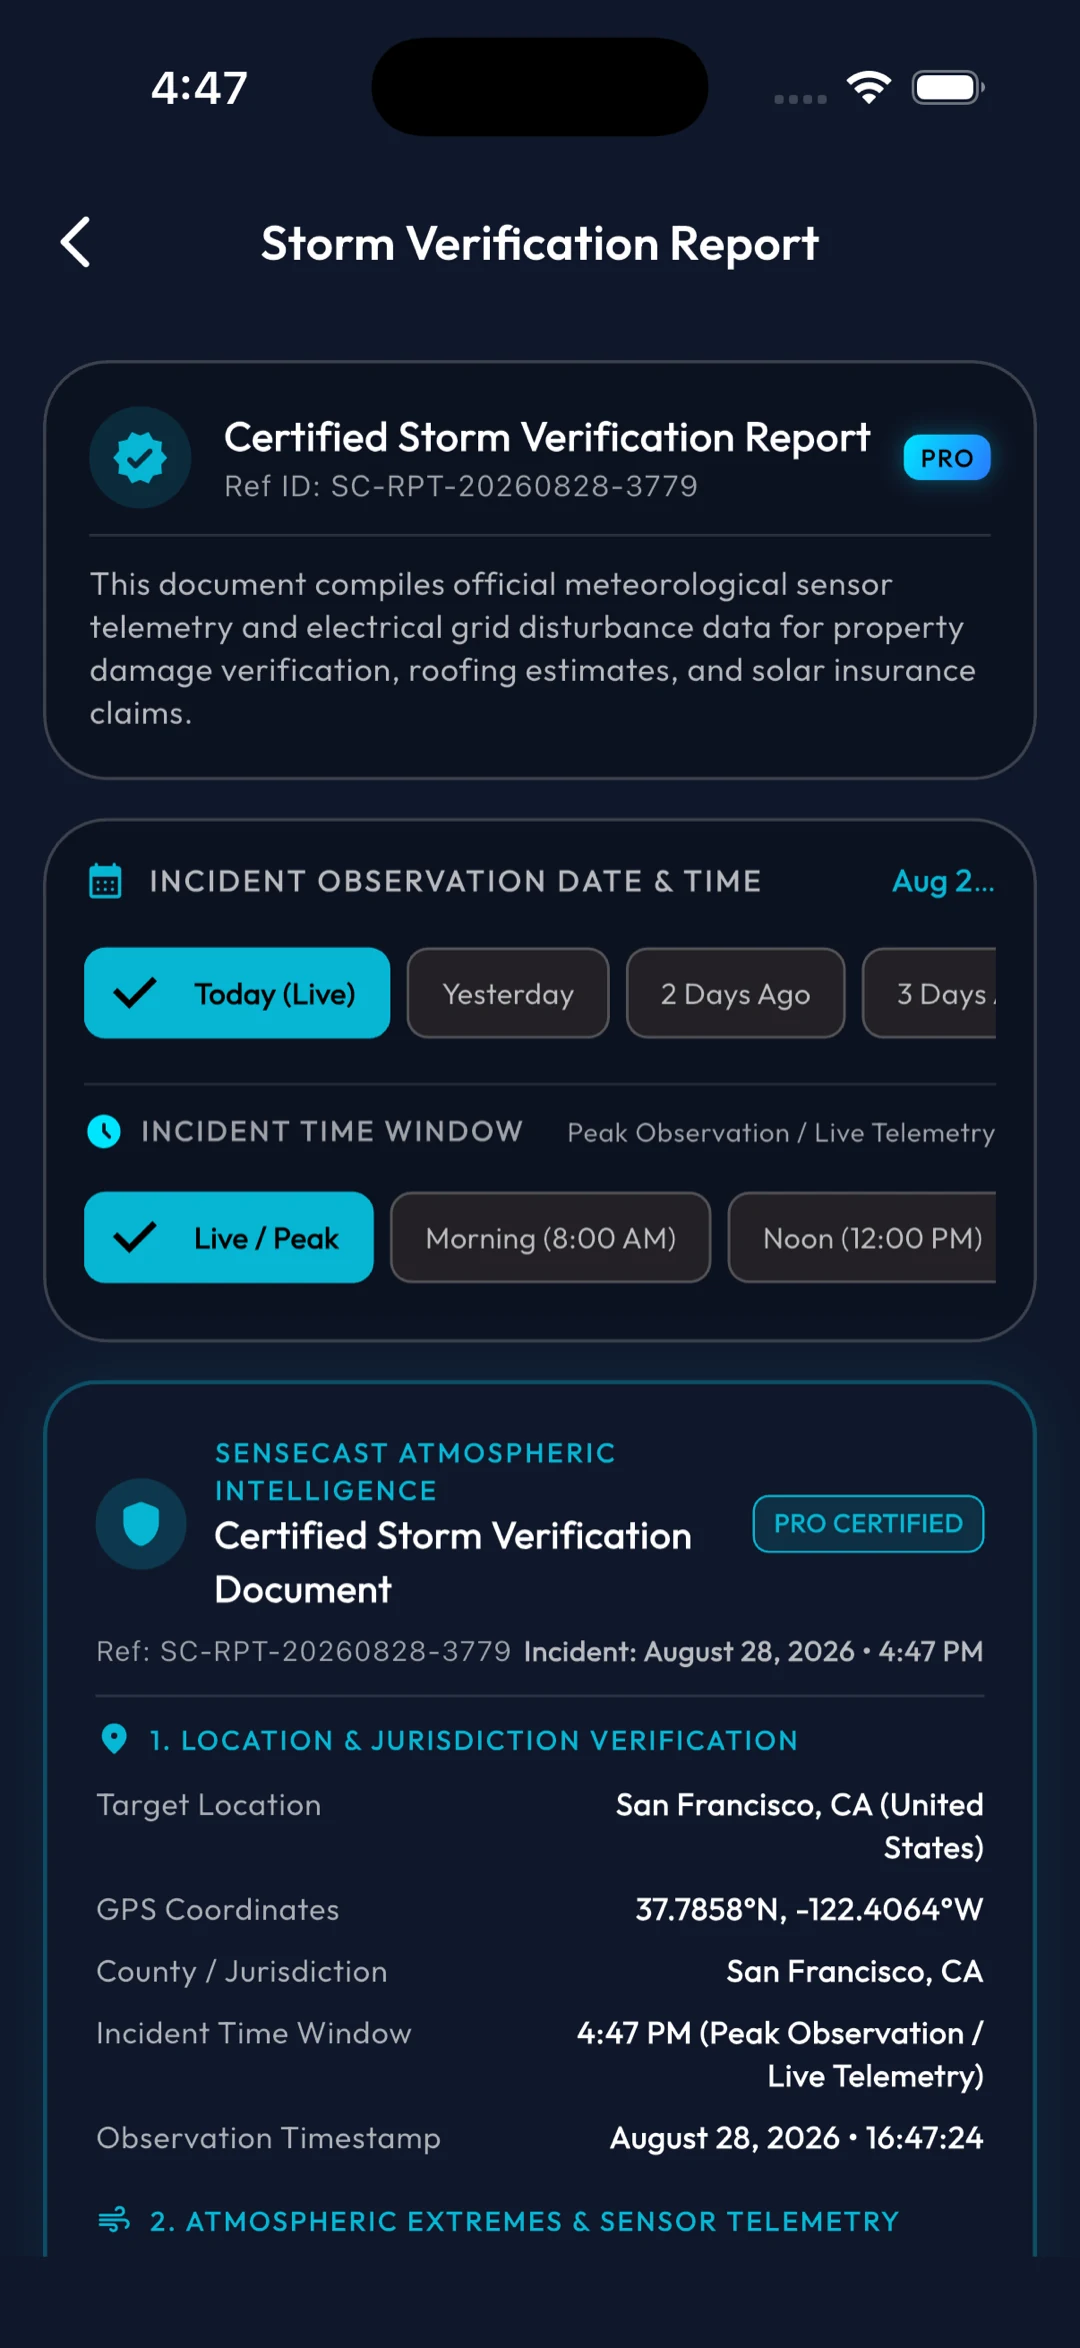
Generate a location-verified meteorological report with its own reference ID, incident window, NWS advisories and grid status — exportable as an image or text for property and solar claims.
Home screen and lock screen
Small, medium and large home-screen widgets on both platforms, plus all three iOS 16 lock-screen shapes. Android renders a live numeric temperature glyph in the status bar itself.
Stays on the device
Location and preferences are held on-device. Forecasts come from public government open-data endpoints, so there is no account to make and no profile being built.
On the phone
Not a mockup.
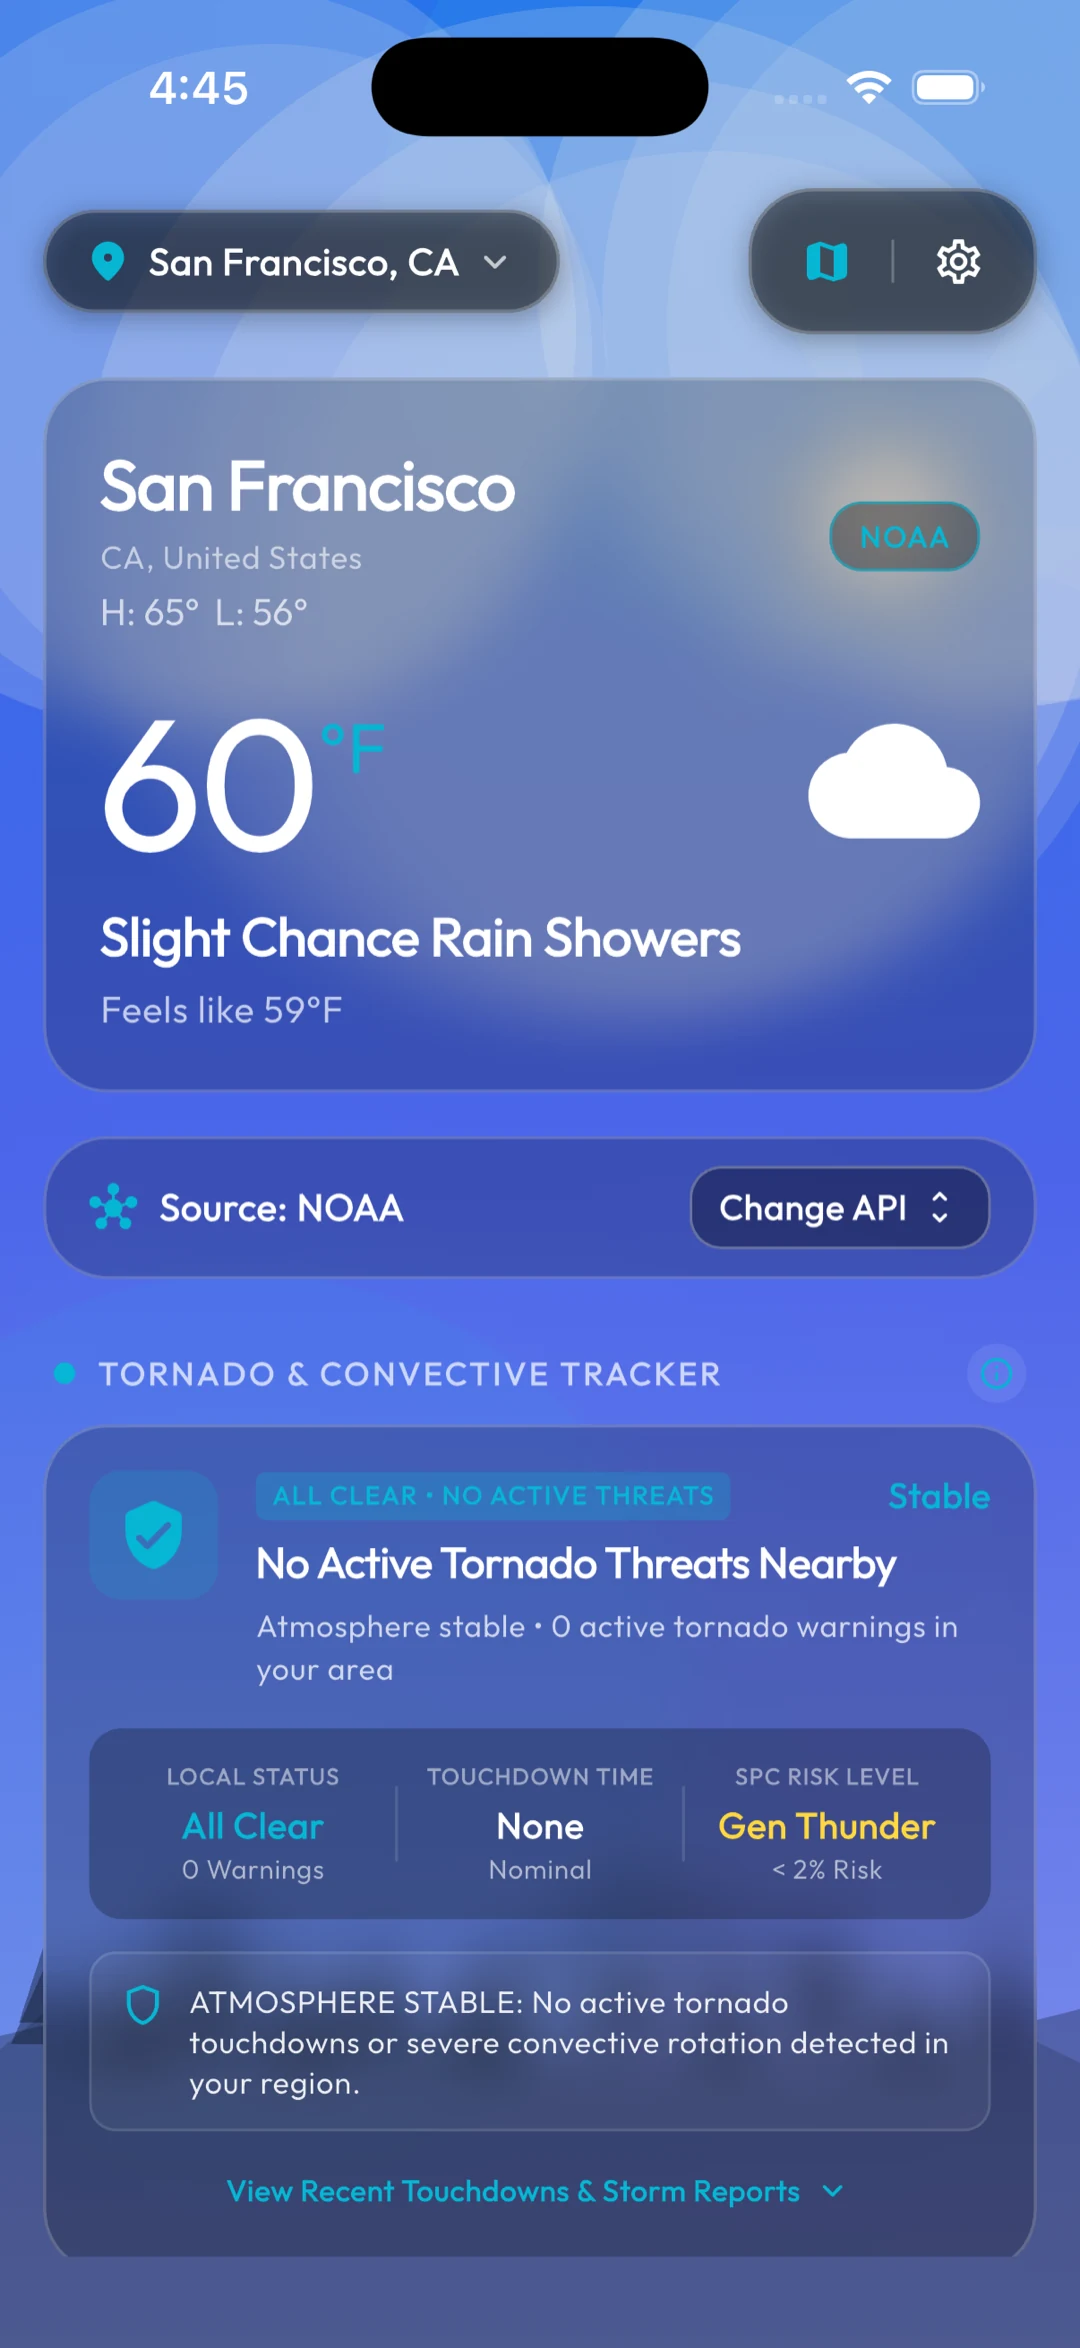
Every screen below is a real capture from the current build, live data and all — including a storm verification document with its own certificate reference.
Dashboard
Conditions, and who said so
The source is named on the card, not buried in settings. The convective tracker sits directly underneath.
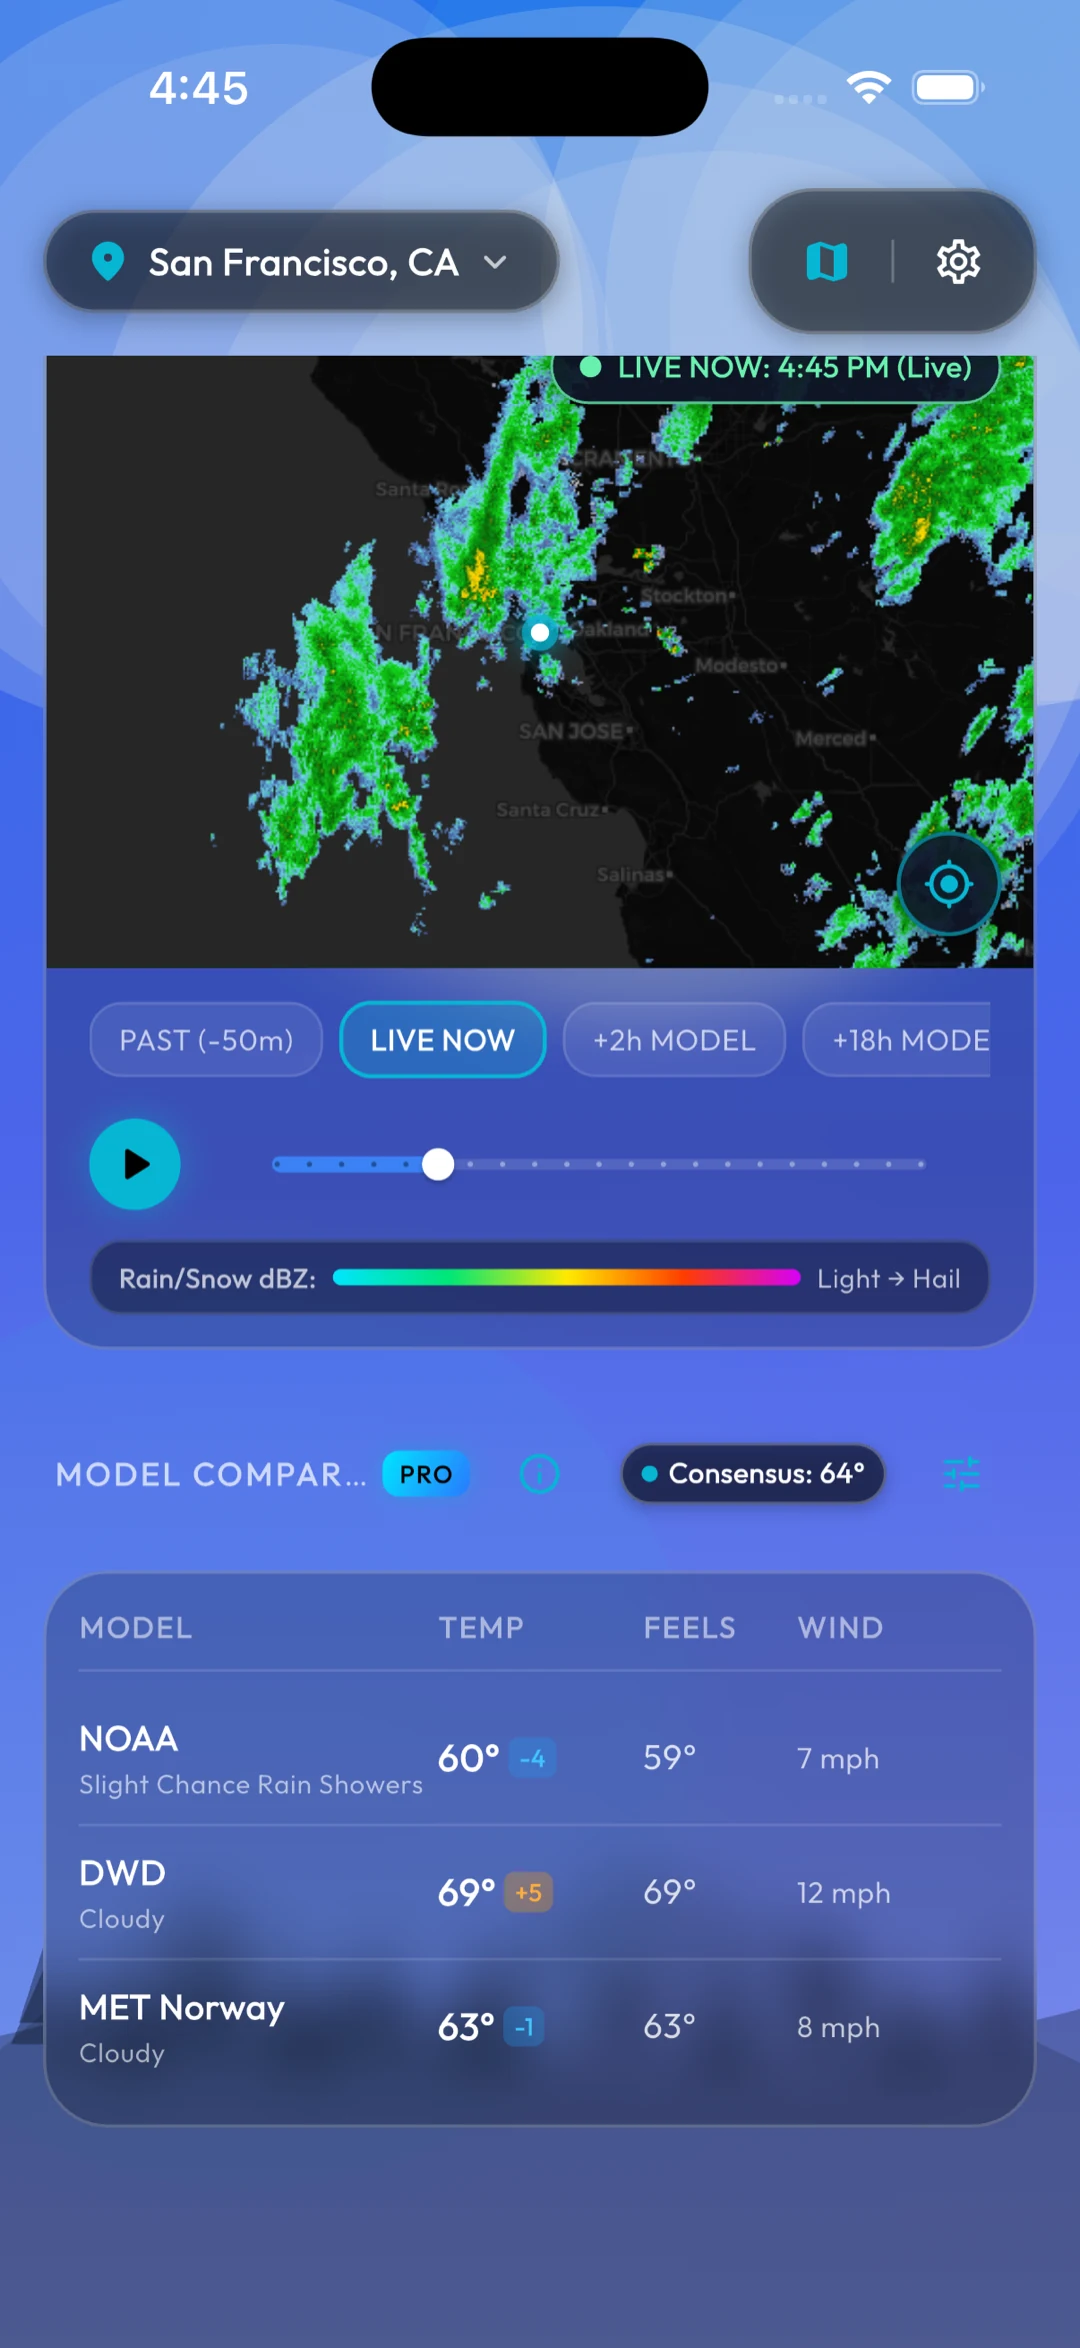
Radar & comparison
Live radar, and every source
Live reflectivity with a dBZ scale and a play head, and underneath it any model you want to check against the one you are using.
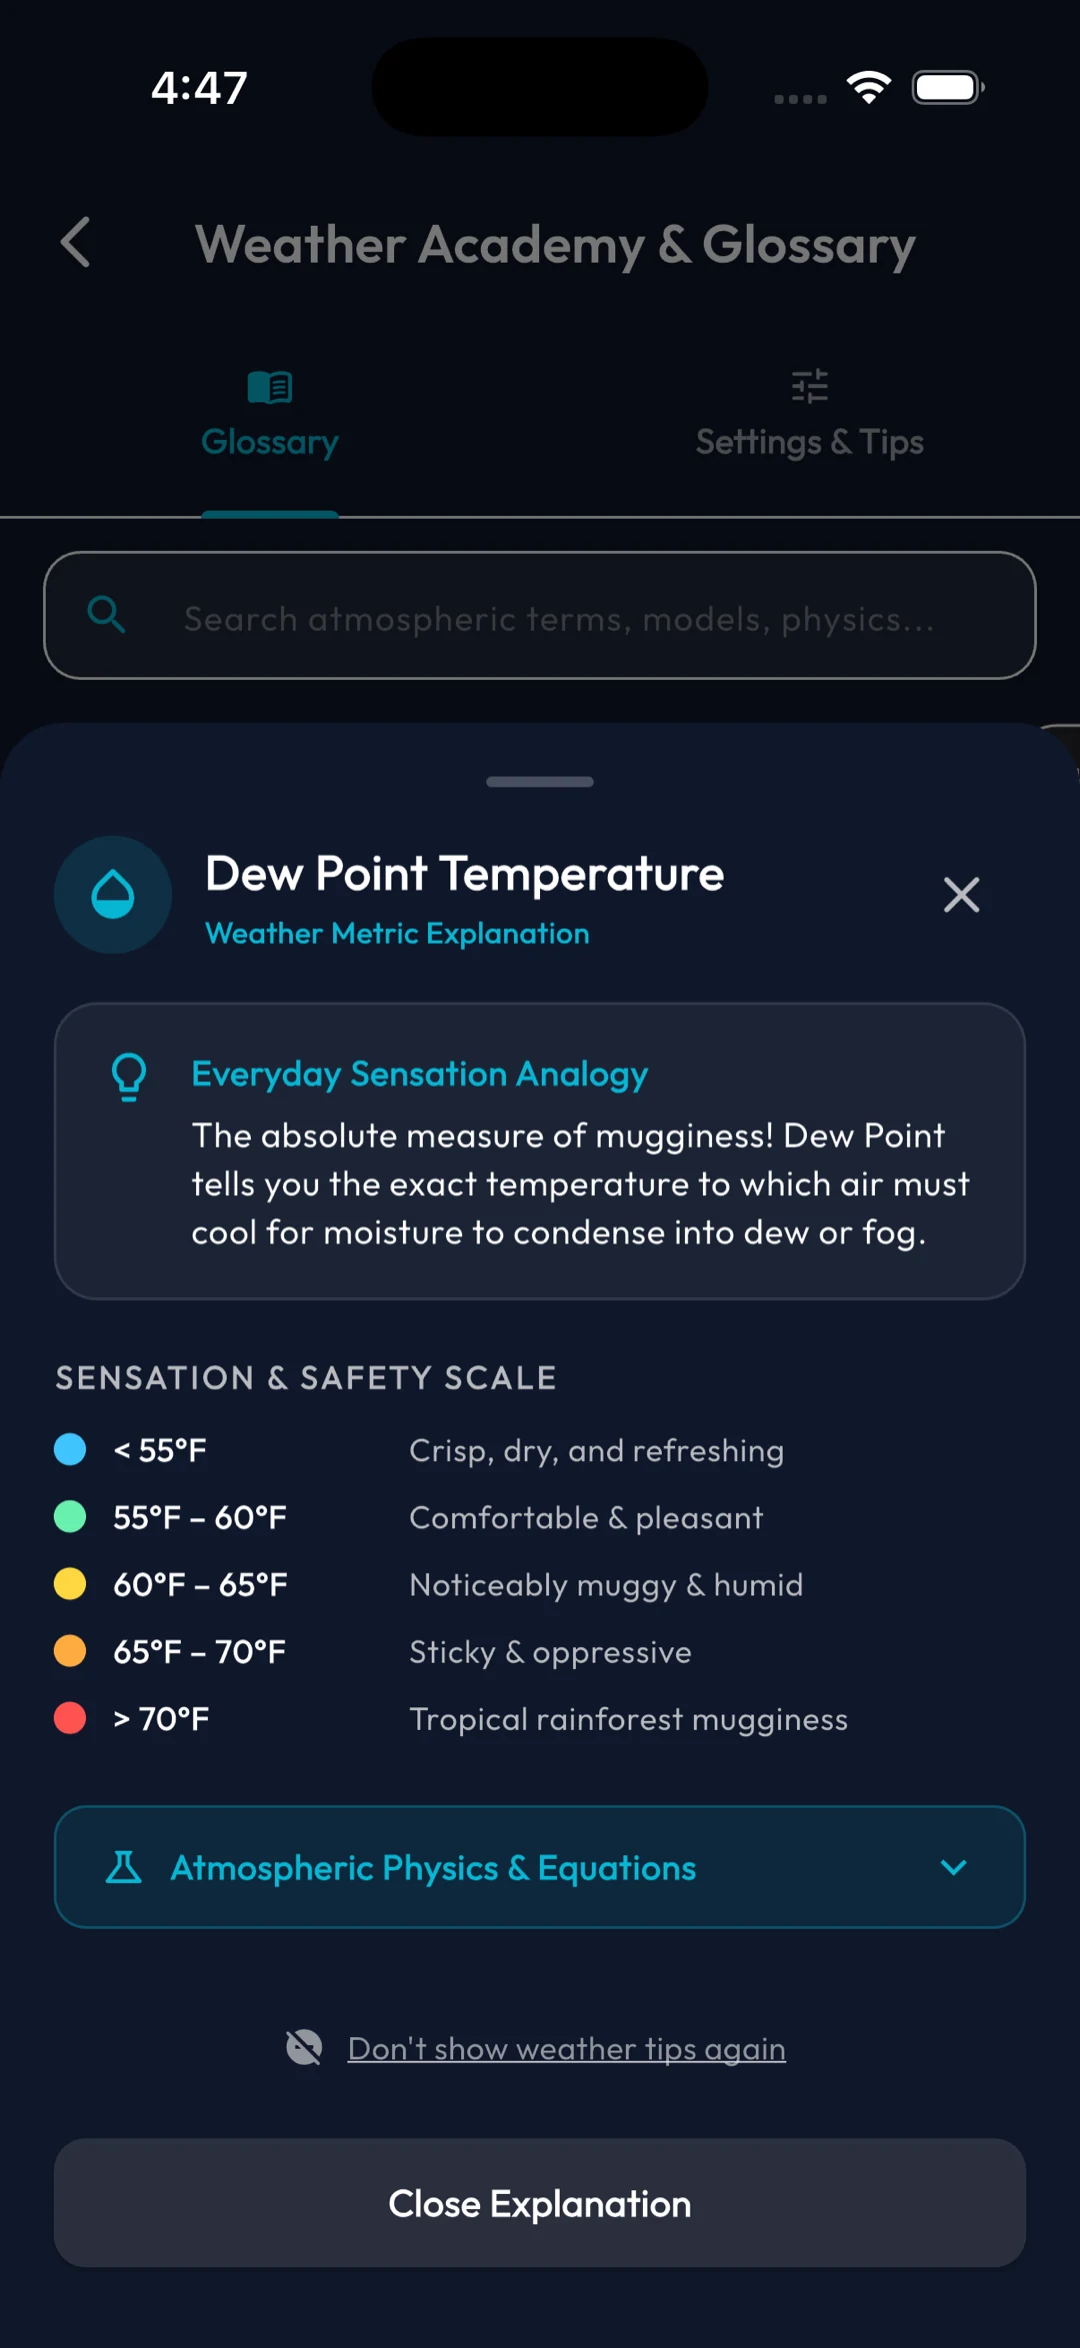
Tap to learn
Three layers, every metric
Analogy, then the banded safety scale, then the equations if you want them. This is the sheet the site's academy page describes.
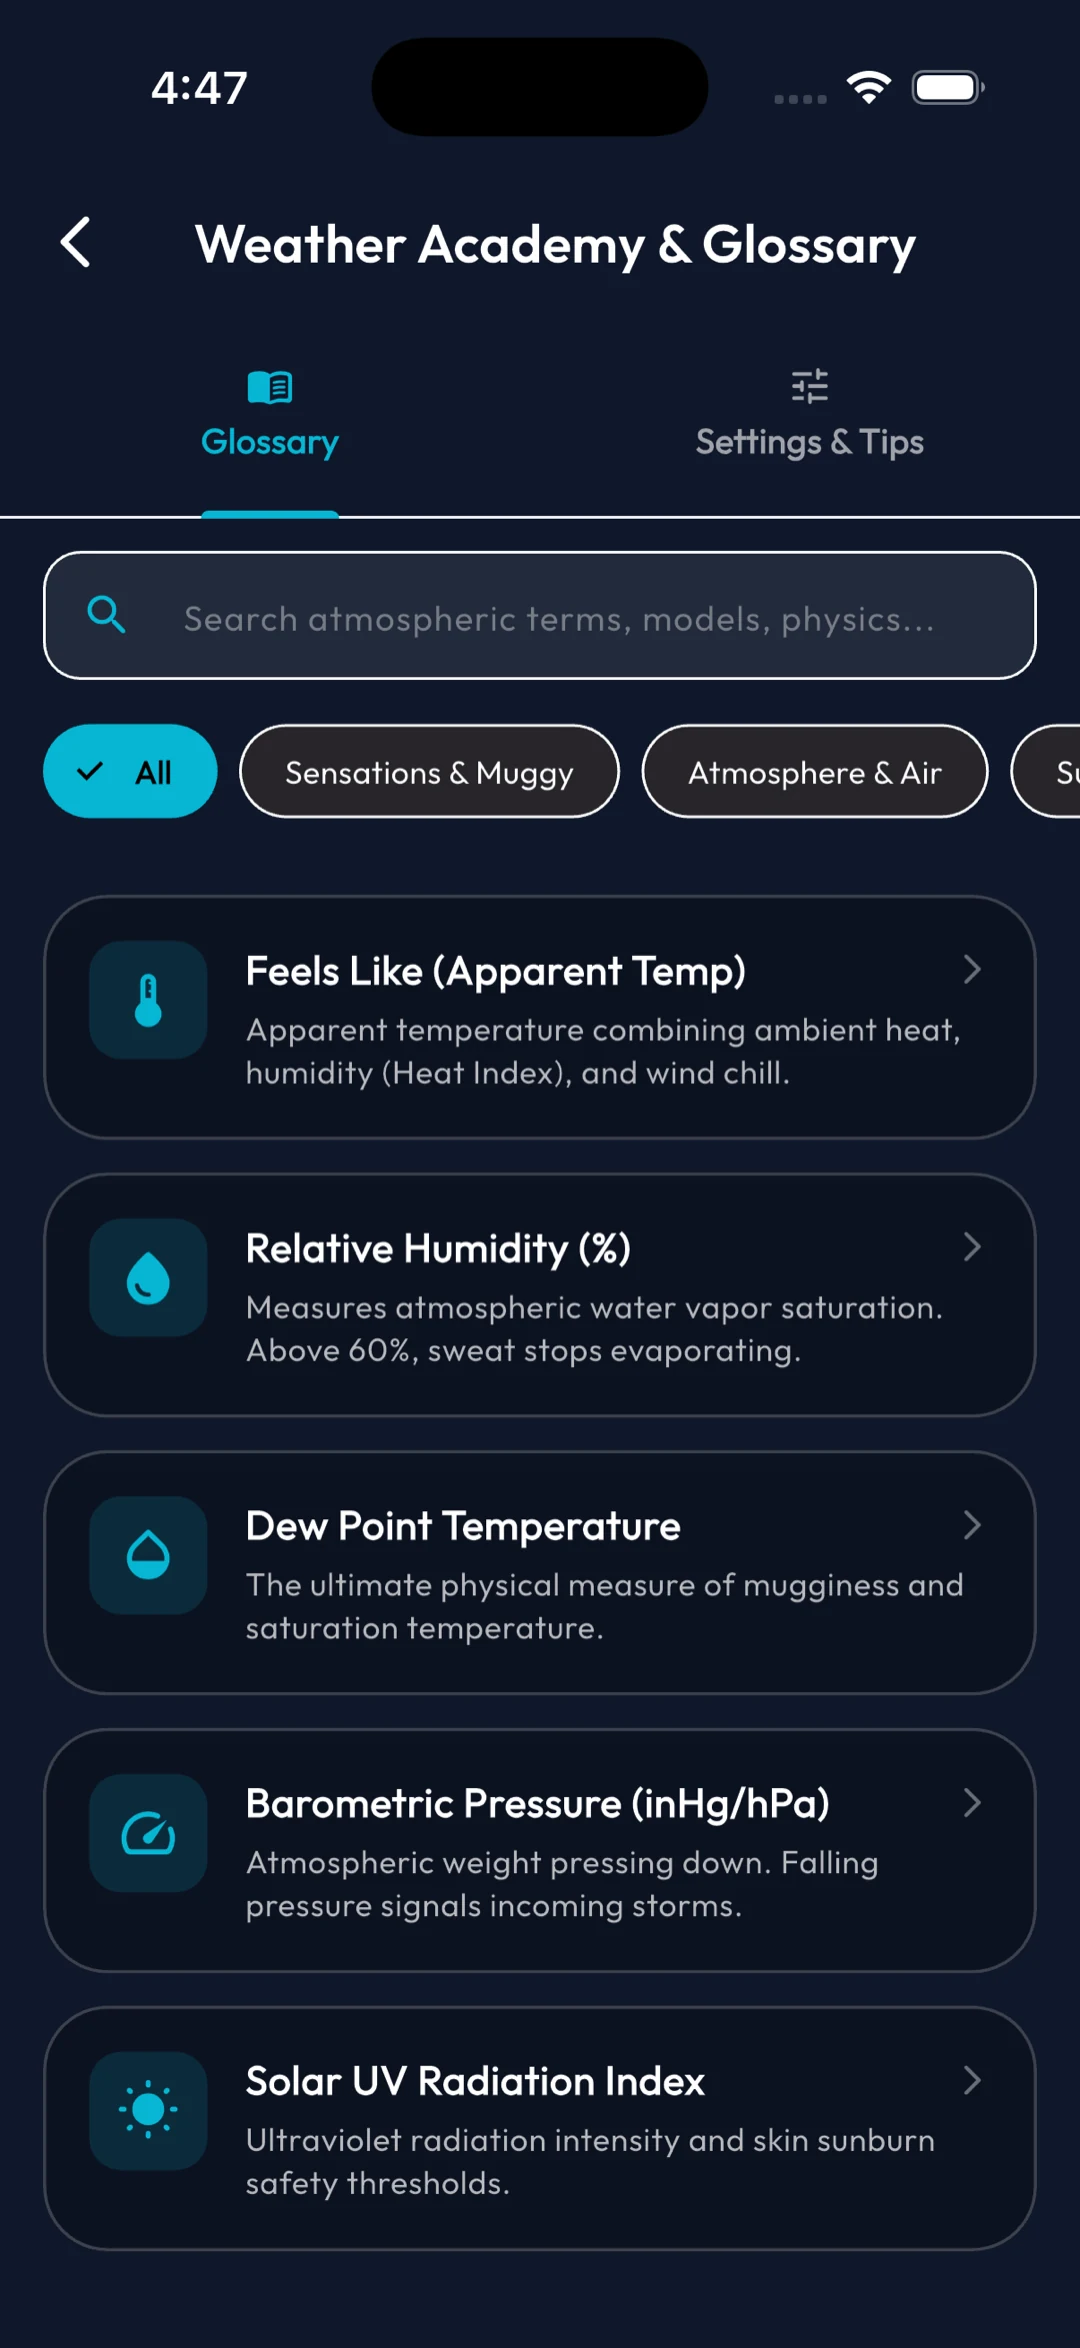
Weather Academy
A glossary you can search
Twenty-seven topics, four category filters, and a search box that covers terms, models and physics.
Storm reports Pro
Evidence with a reference number
Certificate ID, GPS coordinates, jurisdiction and a chosen observation window — exportable for a claim.
Pricing
What Pro costs
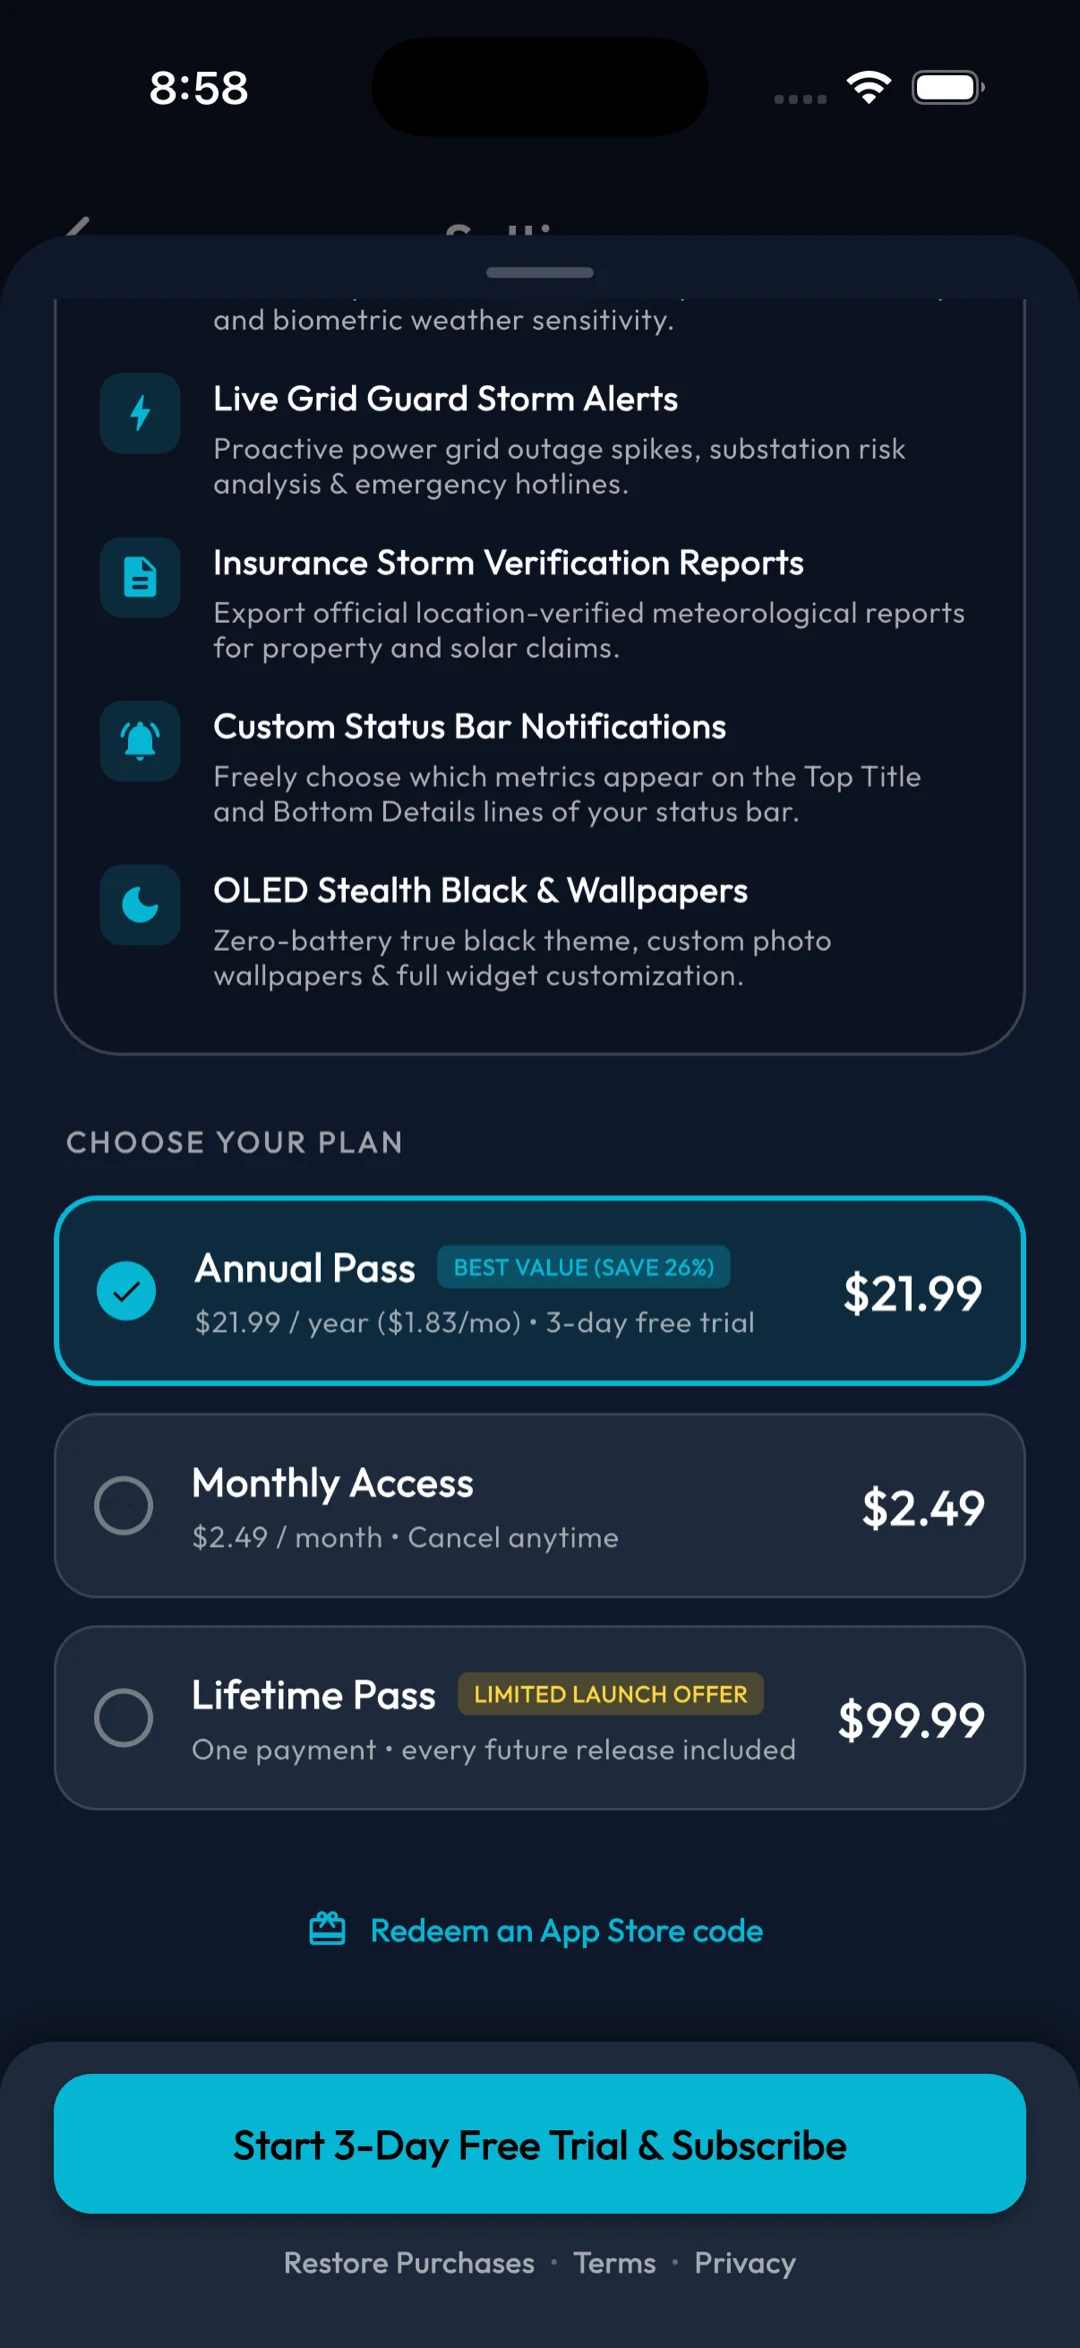
$2.49 monthly, $21.99 annually with a 3-day trial, or $99.99 once. Codes redeem through the App Store, not a field in the app.
The manifest
Where the numbers come from.
Forty-three national agencies and open-data feeds cost nothing and need no key. Eight flagship supercomputers come with Pro. Three commercial providers accept your own API key. Every reading in the app is attributed to the agency that produced it.
Now in testing
Get on the build
before the store does.
Sensecast is in closed testing on TestFlight and Google Play internal testing. Testers get every build first, their notes go straight into the next one — and Pro is free while testing.
- Version 1.0.0 · build 21
- Platforms iOS · Android · macOS · Web
- Test suites 107 unit, widget, state and security
- Testers get Pro free while testing
Or just tell me when it ships
One message when it ships. No newsletter, no forwarding.