The full breakdown
Everything Sensecast does.
A weather app, an atmospheric science school, a severe-weather watch, a power-grid monitor and an insurance documentation tool — running on 50 forecast sources across iOS, Android, macOS and the web.
Severe weather
When it turns dangerous.
The forecast matters less than the hazard. Sensecast runs live watches on the three things that actually change your day: rotation, alerts and the power grid.
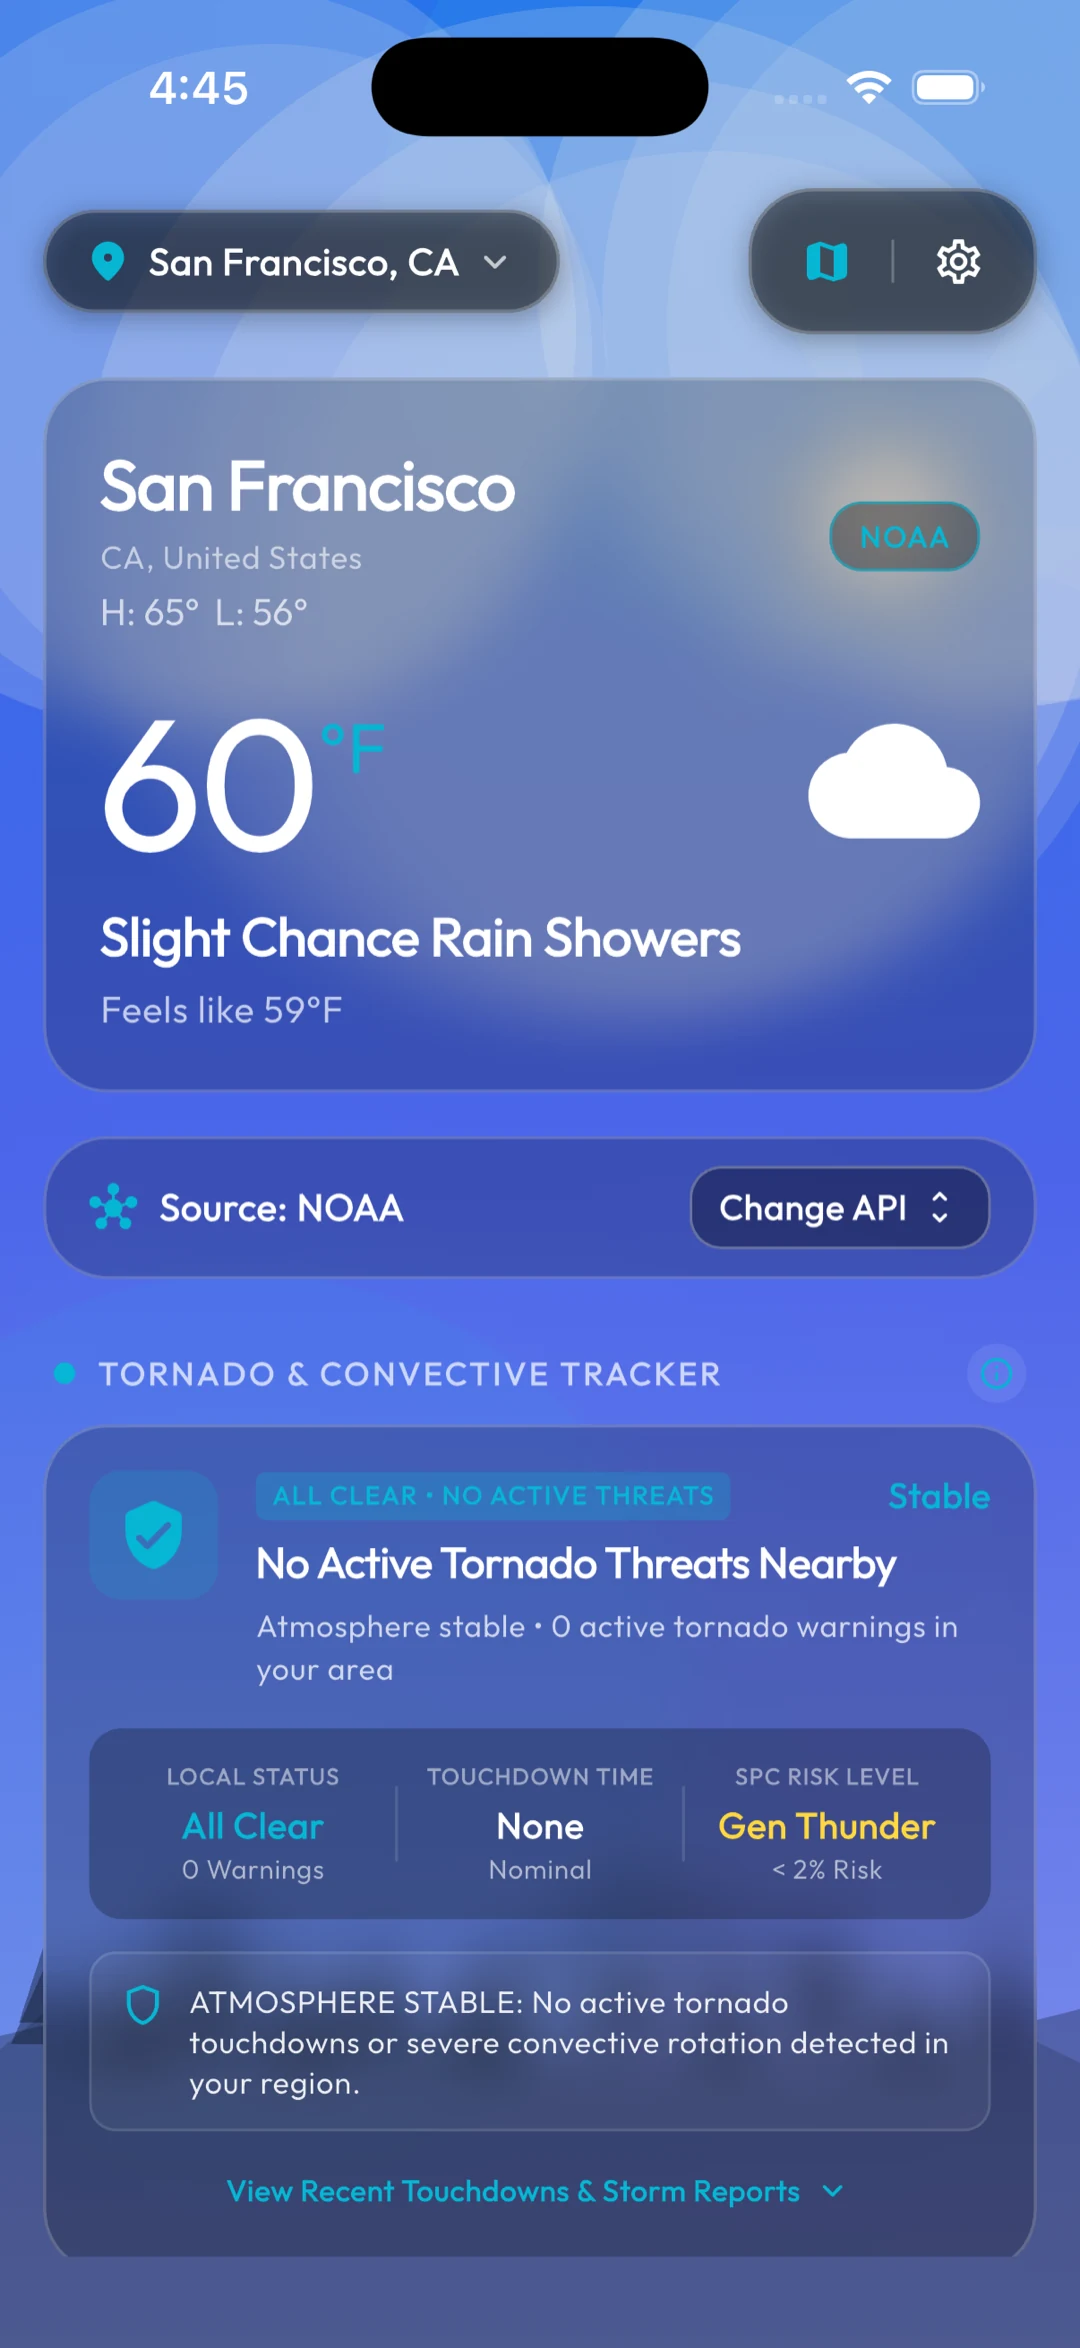
The tracker sits under the forecast, always
Local status, time since the last touchdown and the SPC risk level are on the dashboard whether or not anything is happening — so “all clear” is information too, not an absence.
When the Storm Prediction Center logs a report near you, the same card turns over to county, time and distance.
Live SPC touchdown reports
Reads the NOAA Storm Prediction Center's live and previous-day tornado report feeds, resolves each to county and state, and flags recent touchdowns by age with a local risk status — all clear, watch, or confirmed rotation nearby.
Active warning banner
Official National Weather Service watches, warnings and advisories surface at the top of the dashboard with severity colouring and the full text of the bulletin.
Tropical storm tracker
Active named storms with position and track, for anyone whose season runs June to November.
County outage monitoring
Near-real-time customer outage counts from federal open data, plus a Grid Vulnerability Index that correlates gusts past 50 and 75 km/h, freezing rain and ice accretion, severe convective warnings and extreme thermal demand.
Your utility, already loaded
A directory of local electric utilities — Consumers Energy, DTE, PG&E, SCE, Oncor, CenterPoint, FPL, Duke, ConEd, ComEd and more — with one-tap copyable outage hotlines.
Blackout safety guide
Generator ventilation, the four-hour refrigerator window, and the thirty-foot perimeter around a downed line — in a drawer you can open before you need it.
Documentation Pro
The report you hand to an insurer.
After a storm, the argument is about what actually happened at your address. Sensecast generates a location-verified meteorological record for it.
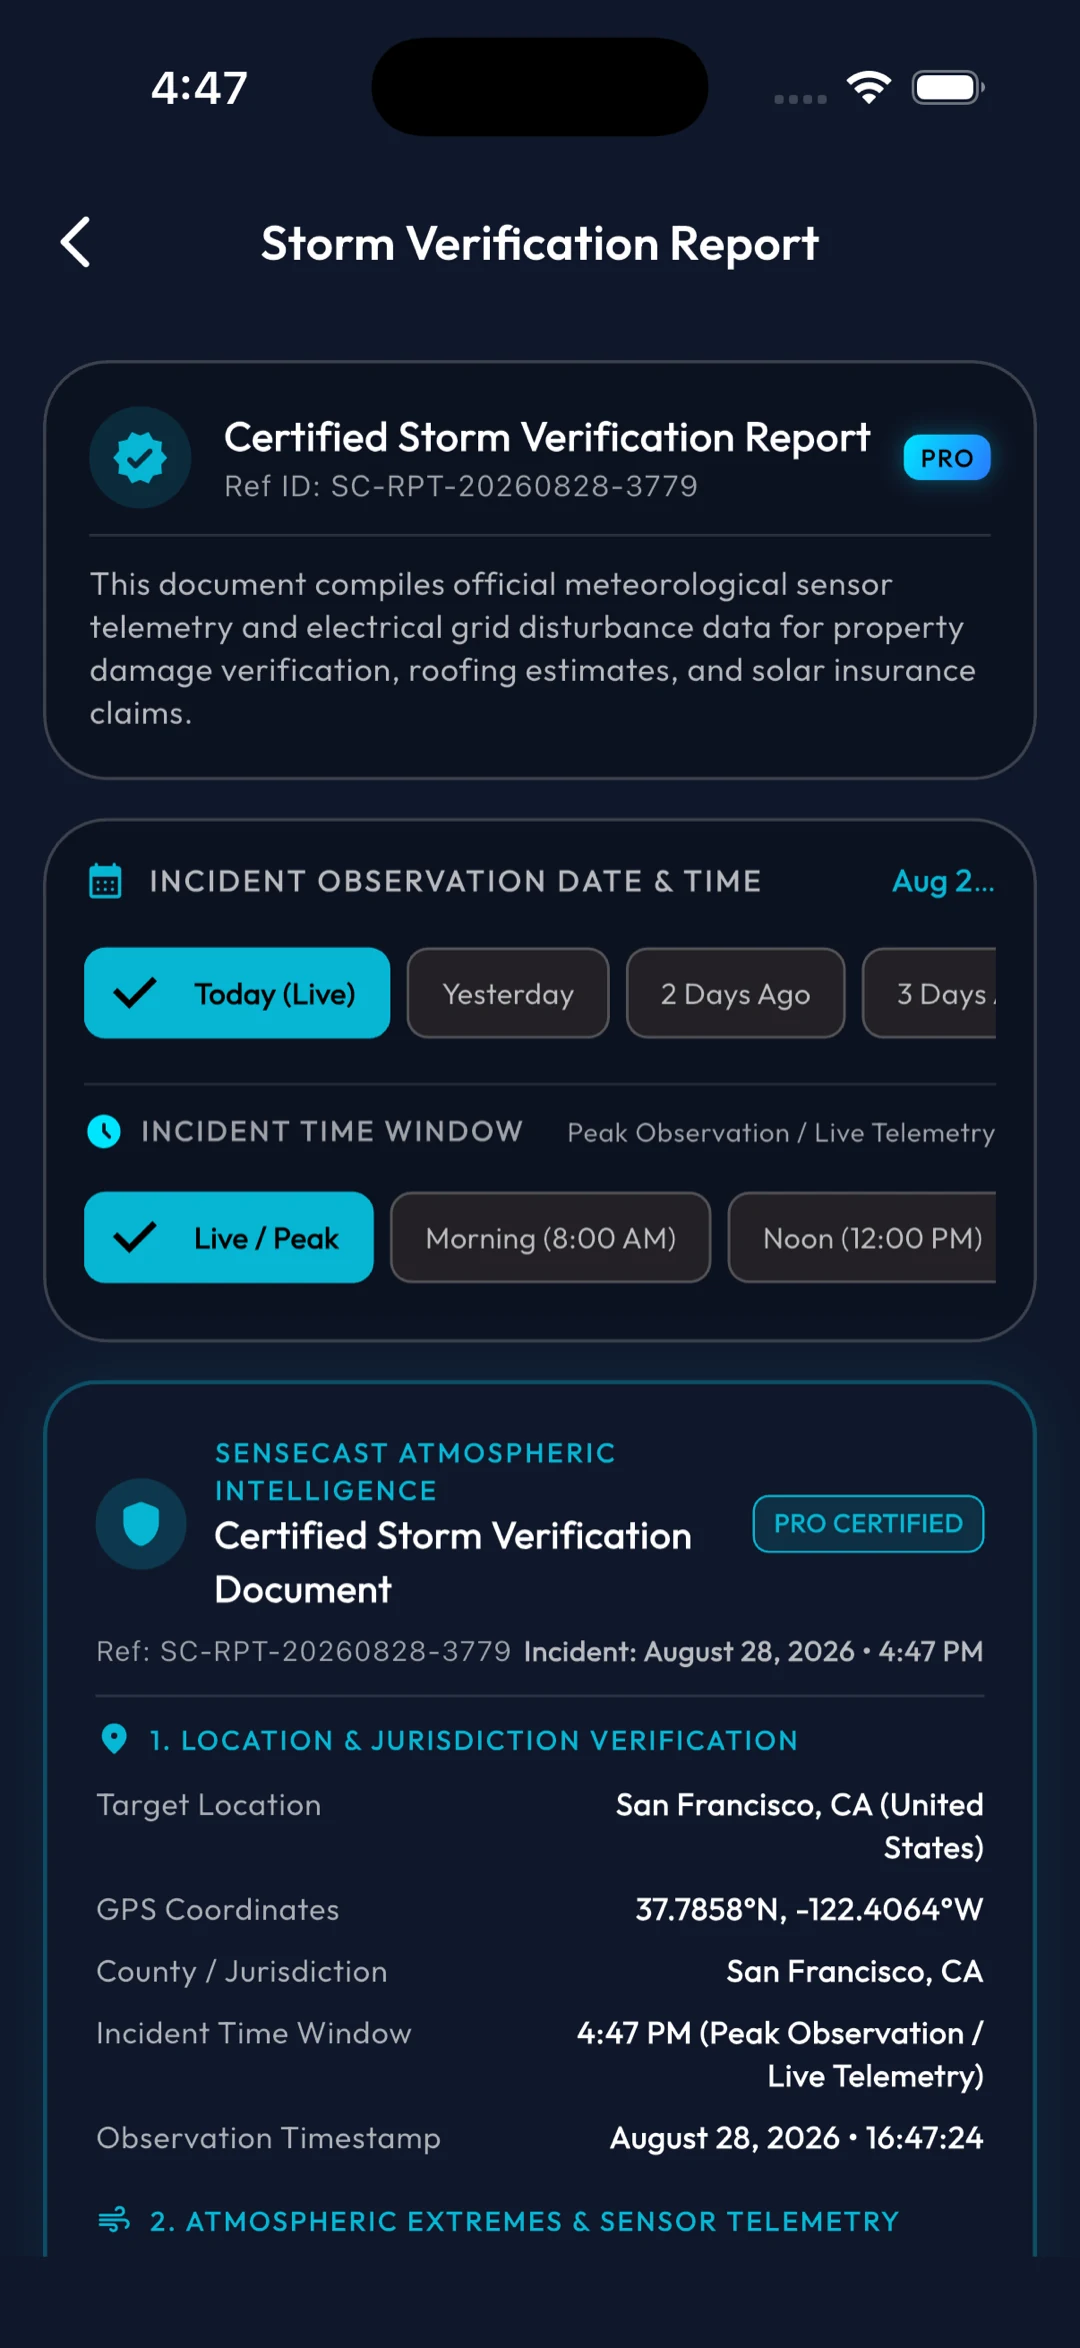
Reference SC-RPT-20260828-3779
Each report carries a certificate ID derived from the date and the coordinates it was taken at, so two reports for different addresses can never be confused for one another.
Underneath it: verified location and jurisdiction, GPS coordinates to four decimals, the observation window you selected, and the timestamp the telemetry was read.
What goes in the report
- Its own certificate reference ID, derived from date and coordinates
- Verified location with latitude and longitude
- Incident date and a chosen observation window
- Peak observed wind, gusts, precipitation and pressure
- Active NWS hazard advisories at the time
- Power utility and grid operating status
Windows you can selectPeak observation · morning 06:00–12:00 · mid-day 12:00–14:00 · afternoon 14:00–18:00 · evening 18:00–22:00 · overnight 22:00–06:00 · or a specified peak disturbance
What you do with it
- Export a rendered report image to share or attach
- Copy a certified text summary to the clipboard
- Pick any past date, not just today
- Built for property damage and solar generation claims
NoteReports are generated from public meteorological observations and are supporting documentation — they are not a substitute for a professional loss adjustment.
Why it exists
Insurers ask for evidence that the weather at your address on a given afternoon was severe enough to explain the damage. That record exists in public data, but it is scattered across agencies and awkward to pull.
Sensecast assembles it from the sources it is already reading, timestamps it, and hands it to you in a form somebody else can check.
SourcesNOAA / NWS observations & advisories · ODIN outage records · station telemetry for the selected window
The daily view
The forecast itself.
A background that means something
A physics-driven canvas: falling raindrops with splash rings, layered drifting clouds, fluttering snow, fog mist, lightning flashes and twinkling starfields — synchronised to solar elevation computed from your coordinates.
Four backdrops
Realistic live weather canvas, clean weather sky with glass gradients, Deep Space OLED true black, or a custom photo from your own library.
Legible on any wallpaper
An adaptive contrast engine measures luminance behind each label and applies drop shadows or contrast borders so readings stay readable on top of your own photograph.
Interactive Doppler
Past 50 minutes, live, and +2h and +18h model nowcasts, with a play head, a colour-coded dBZ legend and satellite infrared cloud overlays on CartoDB Dark Matter basemaps.
Hourly and 7-day
A 24-hour hourly timeline and a seven-day breakdown with high/low range bars, condition icons and precipitation probability.
Drag it into your order
Every card and all 13 condition tiles reorder or disappear: feels-like, humidity, dew point, wind with Beaufort, pressure, UV, visibility, cloud cover, POP, gusts, AQI, solar elevation and moon phase.
Air, sky and season
The things around the temperature.
AQI with the actual pollutants
PM2.5, PM10, ozone and nitrogen dioxide against EPA health thresholds, with particle-size analogies rather than a bare index number.
Pollen forecast
Tree, grass, ragweed and mould counts with peak-season context for each.
Aurora visibility
Geomagnetic Kp index with the viewing latitude band, so you know whether tonight is worth driving north for.
Solar arc and lunar phase
Sunrise, solar noon, sunset and the solar elevation arc, plus moon phase with illumination fraction and a detail sheet.
Saved places
Search and store the places you care about, switch between them from the header, and keep per-location settings — all held on the device.
Every standard on Earth
°F, °C and K. Wind in mph, km/h, knots, m/s, ft/s or Beaufort. Pressure in inHg, hPa, mmHg, mb, atm or psi. Distance in miles, kilometres, nautical miles or metres. 12- or 24-hour clock.
Outside the app
On your home screen and in your status bar.
Three widget sizes
2×2 with city, temperature, condition, range and rain chance. 4×2 with a two-column detail card. 4×4 with a full overview and a four-metric grid — all refreshed on the system timeline.
Temperature in the status bar
A Kotlin method channel renders a live numeric temperature glyph directly into the Android status bar from −40°F to 130°F, backed by a persistent notification carrying condition, rain chance, high/low and provider.
Menu bar and system tray
macOS, Windows and Linux get a tray item with the current temperature as its title and the full detail in the tooltip.
Preview before you place
An in-app widget gallery renders every style and walks through the setup steps for each platform.
Spoken properly
VoiceOver and TalkBack read temperatures, wind and alerts as natural sentences rather than raw numbers, and the app honours Dynamic Type, Reduce Motion, Bold Text and Increase Contrast.
No account, no profile
Location and preferences stay on the device. Forecasts come from public government open-data endpoints, so there is nothing to sign into and nothing being assembled about you.
Now in testing
All of it, on your
phone this week.
Closed testing is open on TestFlight and Google Play, with Pro unlocked for every tester until launch.
Runs on
- iOS 16 and later, including lock screen widgets
- Android status bar glyph and home widgets
- macOS menu bar temperature
- Web installable progressive web app