The full breakdown
Everything Sensecast does.
A weather app, an atmospheric science school, a severe-weather watch, a power-grid monitor and an insurance documentation tool. It runs on 18 forecast sources across iOS, Android, macOS and the web.
Severe weather
When it turns dangerous.
The forecast matters less than the hazard. Sensecast watches the things that actually change your day. Rotation and official alerts, the power grid, earthquakes, wildfires and tropical cyclones — all from the public feeds the agencies publish.
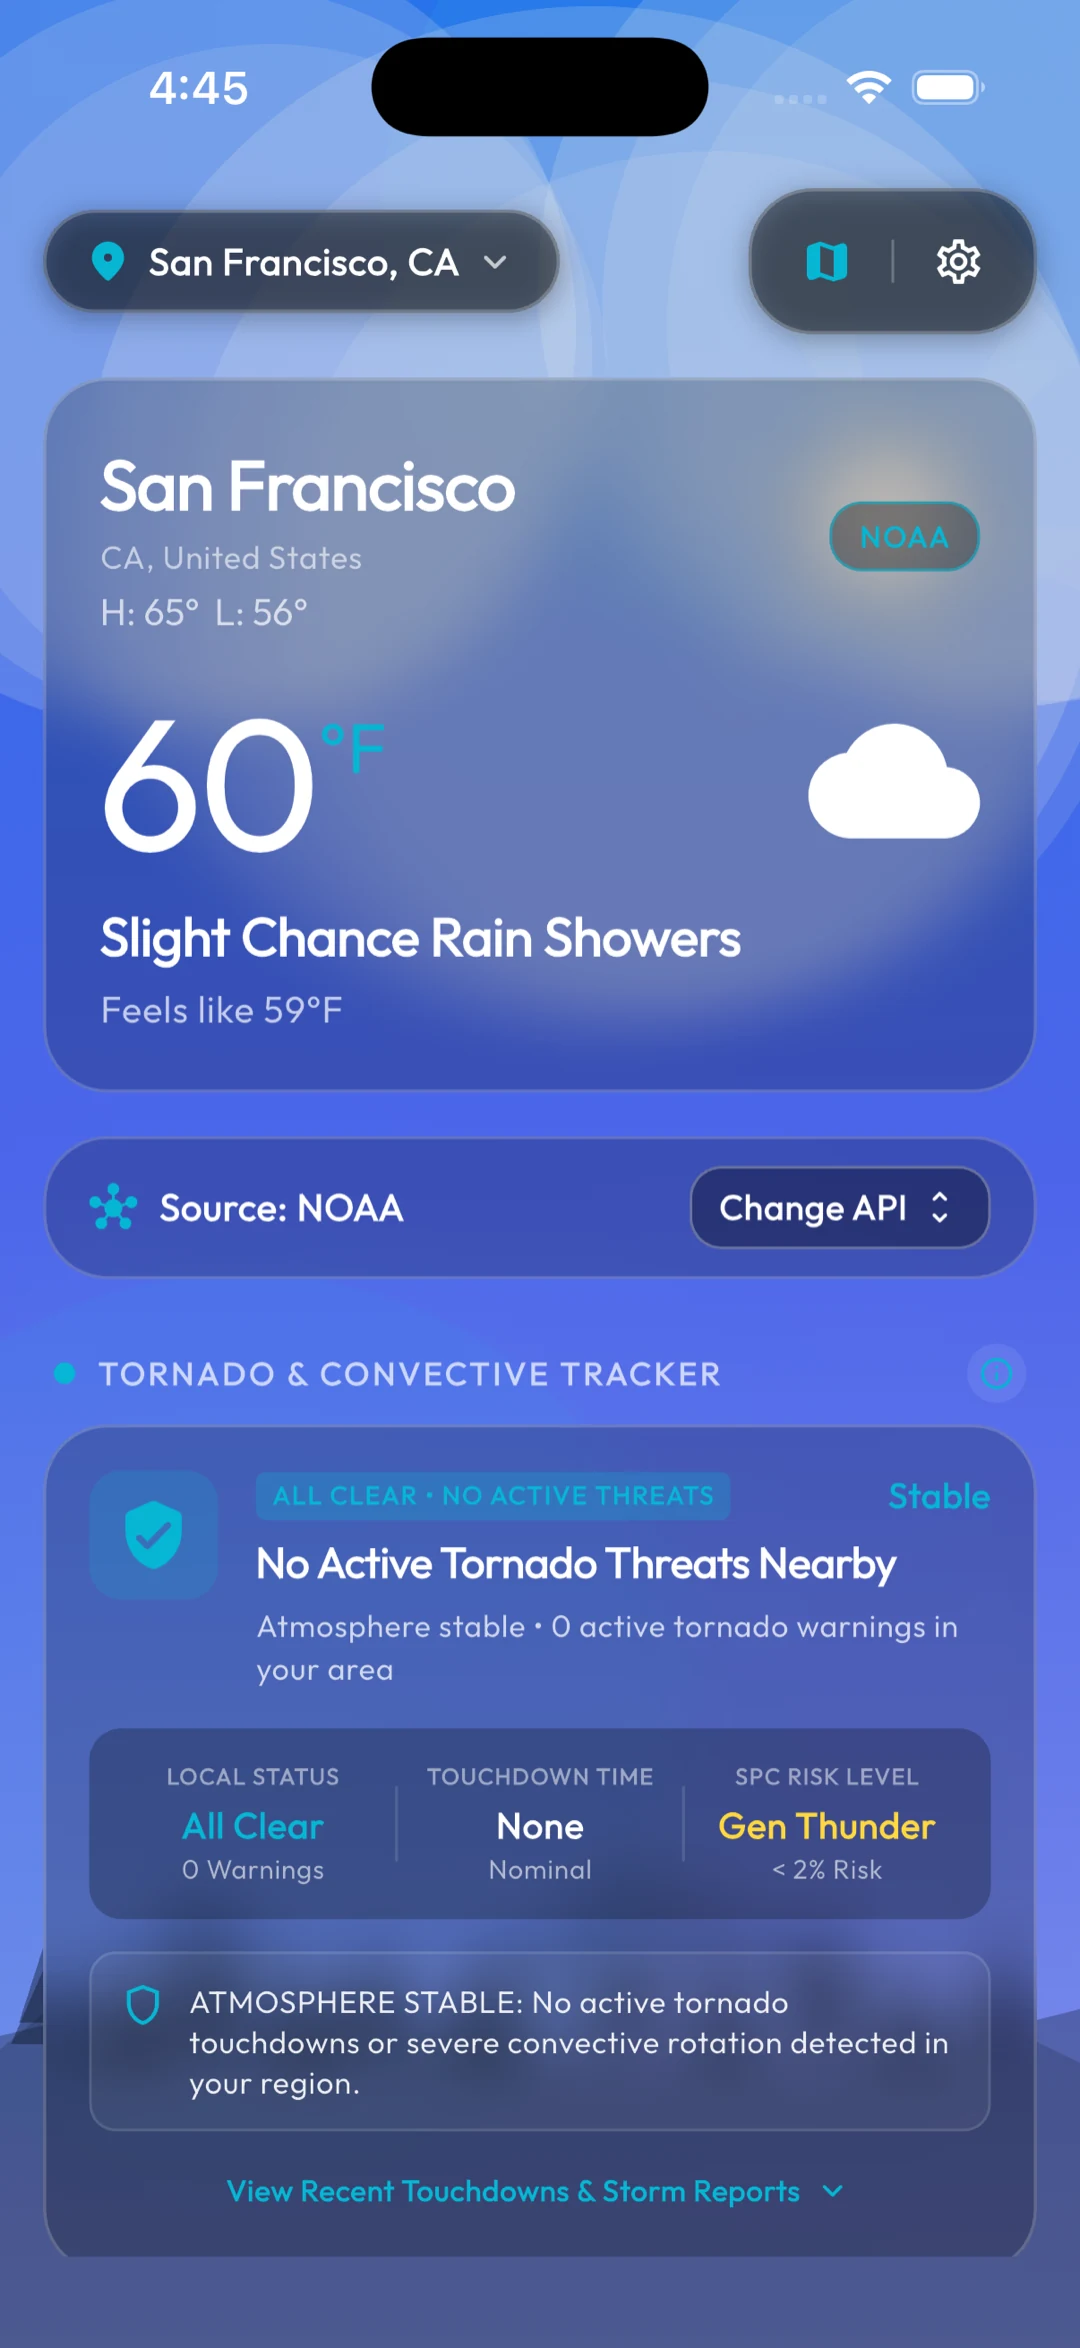
The alert is on the dashboard, not a tab away
Any active National Weather Service watch, warning or advisory surfaces at the top of the scroll. It carries severity colouring and the issuing office, and opens to the full bulletin text.
The tornado and convective tracker, the hazard trackers and the grid monitor follow further down the same dashboard. “All clear” is information too, not an absence.
Live SPC touchdown reports
Reads the NOAA Storm Prediction Center's live and previous-day tornado report feeds. Each report resolves to county and state, flagged by age with a local risk status — all clear, watch, or confirmed rotation nearby.
Active warning banner
Official National Weather Service watches, warnings and advisories surface at the top of the dashboard with severity colouring and the full text of the bulletin. The bulletin text is parsed into the actual hazard — flood, heat, tornado, winter, wind, fire, thunderstorm, hurricane, air quality. A Flash Flood Warning carries a flood mark rather than a generic caution triangle.
Active tropical cyclones
Active named storms with position and track, from GDACS — the UN-backed Global Disaster Alert and Coordination System. For anyone whose season runs June to November, with the card reading “all tropical basins calm” when there is nothing running.
Magnitude 2.5 and up, 500 miles out
The USGS public feed, filtered to quakes near you from the past day. Each report carries magnitude, depth and a great-circle bearing, so it reads “38 miles NNE” rather than just “38 miles away”. It reports what has already happened — no app can warn you beforehand.
Satellite thermal anomalies
NASA FIRMS VIIRS detections within 150 miles, refreshed from the near-real-time feed. Each carries its Fire Radiative Power and a great-circle bearing so you know which way it is. These are heat signatures seen from orbit rather than confirmed perimeters, and the card says so.
County outage monitoring
Near-real-time customer outage counts from federal open data. Plus a weather risk score for the local grid. Sensecast estimates it from gusts past 50 and 75 km/h, snow and freezing rain, thunderstorm and tornado warnings, and extreme heat or cold.
Your utility, already loaded
A directory of local electric utilities with one-tap outage hotlines — Consumers Energy, DTE, PG&E, SCE, Oncor, CenterPoint, FPL, Duke, ConEd, ComEd and more.
Blackout safety guide
Generator ventilation, the four-hour refrigerator window, and the thirty-foot perimeter around a downed line — in a drawer you can open before you need it.
Every watch on one map
SPC storm reports and the Day 1 outlook, NWS warning polygons, USGS earthquakes, FIRMS fire detections, GDACS cyclone tracks, county outage shapes and the aurora oval — all on one map. Pick a 24-hour, 3-day or 7-day window, and tap any feature for its name, bearing and source. A Sensecast Pro map, one tap from each tracker card.
Documentation Pro
The report you hand to an insurer.
After a storm, the argument is about what actually happened at your address. Sensecast generates a location-verified meteorological record for it.
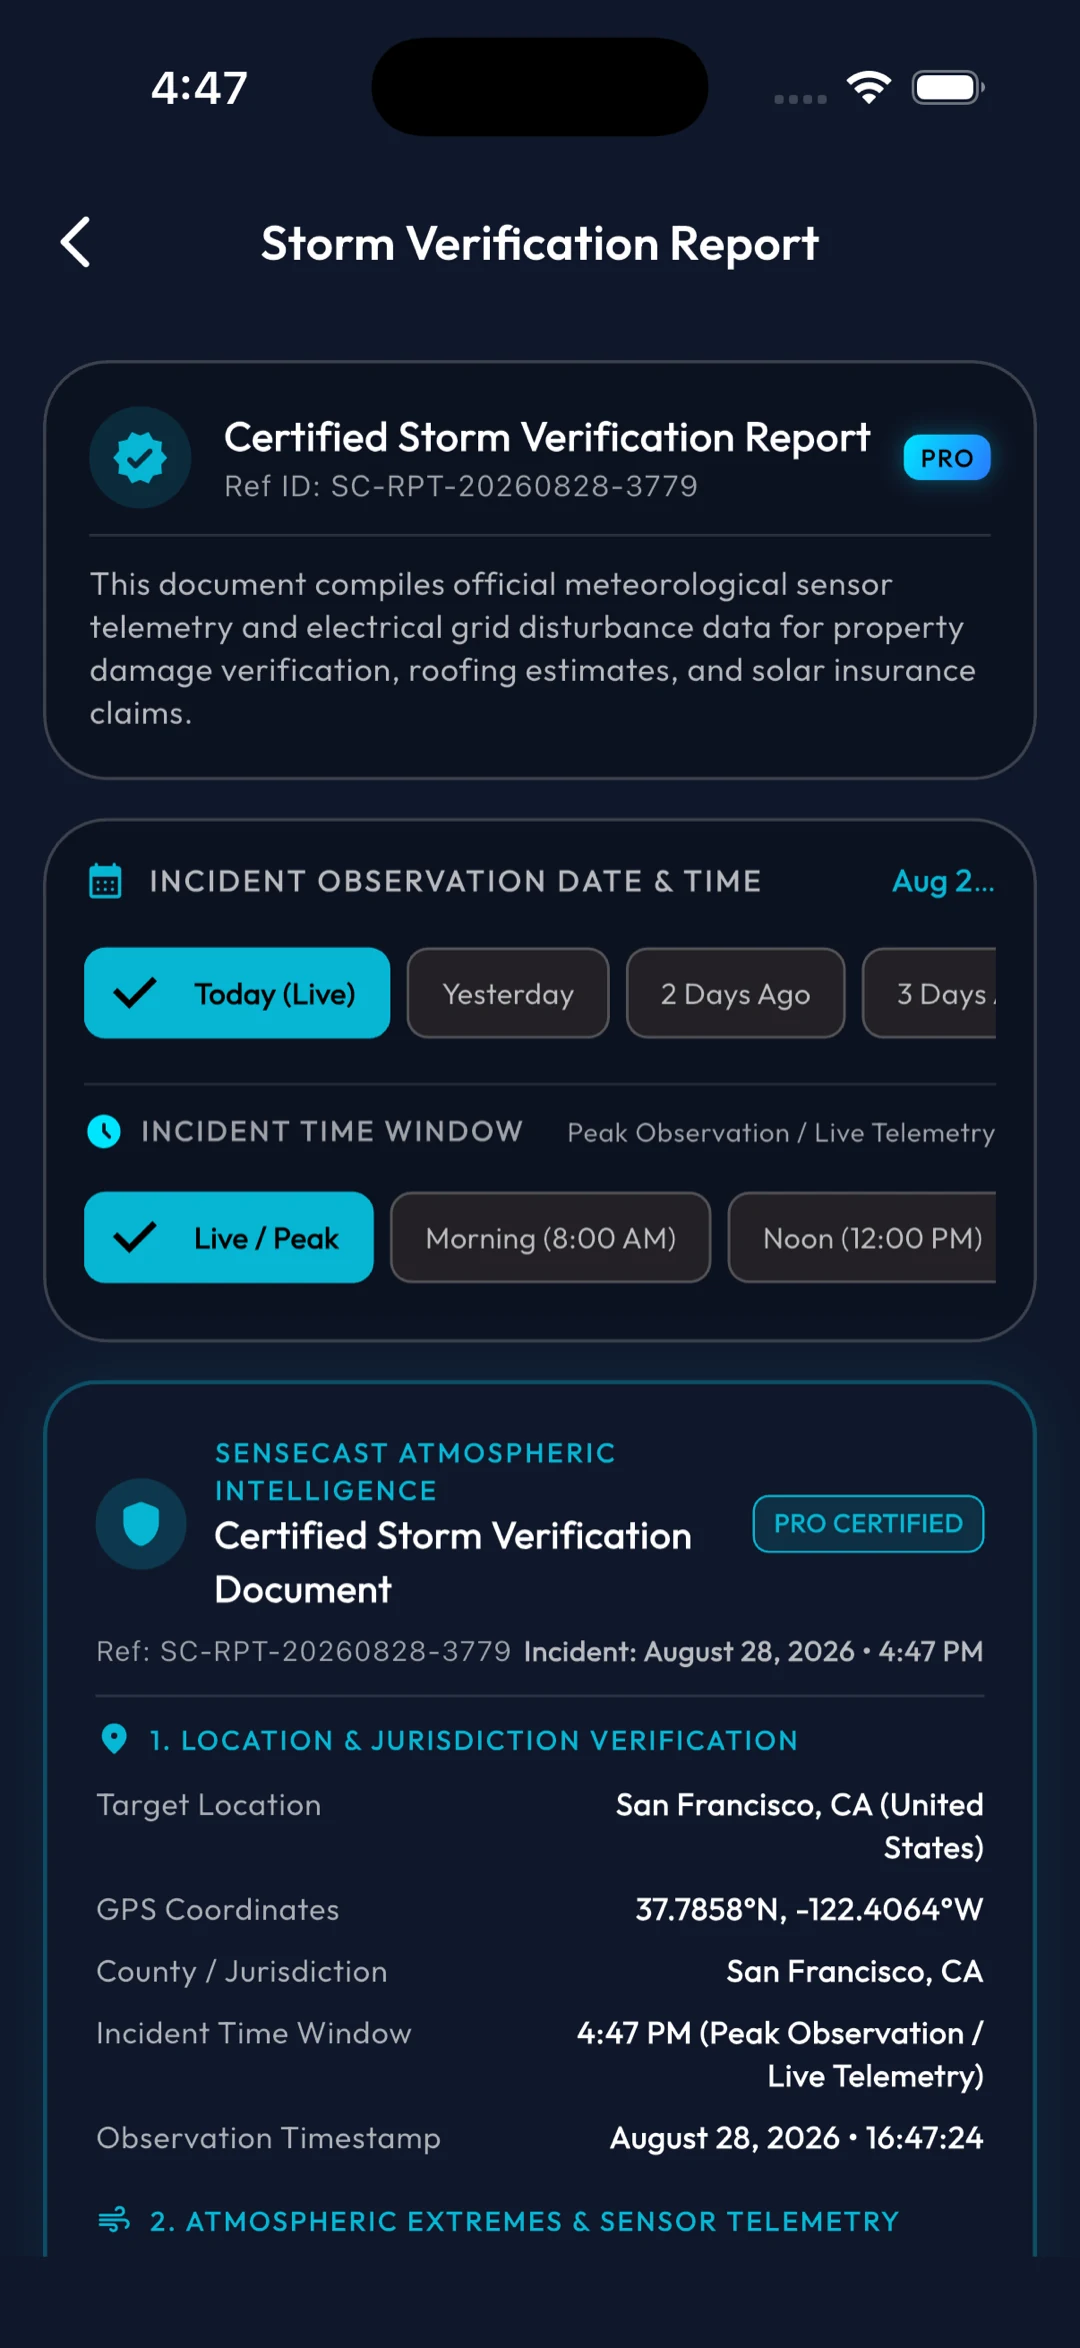
Reference SC-RPT-098B171FC4248454
Each report carries a randomly generated reference ID, registered the moment it is created. Whoever receives it — an insurer or an HOA — can confirm it is genuine at sensecast.app/verify instead of taking your word for it.
Underneath it: location and jurisdiction, GPS coordinates to four decimals, and the weather for the window you selected. Everything is in the location’s own time zone, with every source named on the report.
What goes in the report
- Its own reference ID, checkable at sensecast.app/verify
- Location with latitude and longitude
- Incident date and a chosen observation window
- Peak gust, sustained wind, precipitation, pressure and the most significant weather for the window, from Open-Meteo’s hourly model analysis (estimates for your location)
- The nearest airport weather station’s measured peak gust and observed weather, such as hail or thunder (U.S.)
- The NWS watches and warnings in effect during the window (U.S.)
- Power utility and outage status (live reports)
Windows you can selectLive / peak · morning 8:00 AM · noon 12:00 PM · afternoon 2:30 PM · evening 7:00 PM · night 10:00 PM · or a specific time — for today, one of the past three days, or any date in the past two years
What you do with it
- Export a rendered report image to share or attach
- Copy a text summary to the clipboard
- Pick any past date, not just today
- Built for property damage and solar generation claims
NoteReports are generated from public meteorological observations and are supporting documentation — they are not a substitute for a professional loss adjustment.
Why it exists
Insurers ask for evidence that the weather at your address on a given afternoon was severe enough to explain the damage. That record exists in public data, but it is scattered across agencies and awkward to pull.
Sensecast assembles it from the sources it is already reading, timestamps it, and hands it to you in a form somebody else can check.
SourcesNOAA / NWS observations & advisories · ODIN outage records · station telemetry for the selected window
The daily view
The forecast itself.
A background that means something
A physics-driven canvas: rain with splash rings, snow, sleet, hail, haze, fog, layered clouds and lightning — synchronized to solar elevation. Particles pause when the app is backgrounded.
Five canvases, not three
Free: Dynamic (live particles) and Clean Weather Sky (gradients only). Pro adds three more: Atmosphere — photographic plates per condition and time of day — OLED Stealth (pure #000000), and Custom Photo (your image, never uploaded).
Legible against any sky
An adaptive contrast engine measures the luminance behind each label and applies drop shadows or contrast borders. Readings stay readable whether the sky behind them is a bright noon blue or a dark overcast night.
Interactive Doppler
Roughly two hours of past sweeps and a nowcast about an hour ahead, from LibreWXR, with a play head and a legend in the colours you picked. Every tile is cached to disk as it loads. Scrubbing back through the loop is instant and never flashes black between sweeps.
Weather layer, rain colours, map background
Flip the weather layer between rain-and-snow radar and infrared cloud satellite. Pick the rain colours from Universal Blue, Classic NEXRAD, Dark Sky or Titan, each previewed light to heavy before you choose. Set how see-through the weather layer is. The map underneath swaps between a dark map, satellite photos and a light map — all live, without leaving the radar.
Hourly and 7-day
A 24-hour hourly timeline and a seven-day breakdown with high/low range bars, condition icons, precipitation probability and an hourly UV index curve. UV is published where the source measures it, and disclosed as a solar-angle estimate where it does not.
Two dashboards, one switch
A "Widget Board Layout" switch in Settings swaps the data-dense standard layout for a Widget Board — the same glass widget cards from the gallery, promoted onto the home screen, in every accent colour. Your choice persists between launches.
The wallpaper follows the weather
Pro Weather Wallpaper carries the same scenes past the app itself. Choose a verified 44-scene photographic pack or illustrated scenes drawn on-device. It applies on Android's home and lock screen even with the app closed, and to every display on macOS, Windows and Linux. On iOS, a "Get Sensecast Wallpaper" Shortcuts action hands the current scene to your own automations.
Drag it into your order
Every card and all 13 condition tiles reorder or disappear. That covers feels-like, humidity, dew point, wind with Beaufort, pressure, UV, visibility, cloud cover, POP, gusts, AQI, solar elevation and moon phase.
Survives a bad connection
Every forecast is cached to disk. A dropped signal or a failed provider shows the last good reading with a quiet offline note instead of an empty error. When something is genuinely wrong, the built-in Connection Diagnostics screen tests DNS, TLS, each provider endpoint and the device clock separately. You get one shareable report.
Air, sky and season
The things around the temperature.
AQI with the actual pollutants
PM2.5, PM10, ozone and nitrogen dioxide against EPA health thresholds, with particle-size analogies rather than a bare index number. In the US the headline figure comes from the nearest EPA AirNow monitoring station — a real reading rather than a model. Everywhere else it falls back to Open-Meteo's global estimate.
Aurora visibility
Geomagnetic Kp index with the viewing latitude band, so you know whether tonight is worth driving north for.
Solar arc and lunar phase
Sunrise, solar noon, sunset and the solar elevation arc, plus moon phase with illumination fraction and a detail sheet.
Saved places
Search and store the places you care about, switch between them from the header, and keep per-location settings — all held on the device.
Every standard on Earth
°F, °C and K. Wind in mph, km/h, knots, m/s, ft/s or Beaufort. Pressure in inHg, hPa, mmHg, mb, atm or psi. Distance in miles, kilometres, nautical miles or metres. 12- or 24-hour clock.
Outside the app
On your home screen and in your status bar.
Three widget sizes
2×2 with city, temperature, condition, range and rain chance. 4×2 with a two-column detail card. 4×4 with a full overview and a four-metric grid — all refreshed on the system timeline.
Its own weather marks
The condition symbols are hand-built vector artwork on a 24-pixel grid, not system icons or emoji — eleven marks with separate day and night variants. The same shapes are drawn three times — in Flutter, in SwiftUI and as Android vector drawables. The preview in the gallery is exactly what lands on your home screen.
Widgets in your colours
Five Pro colour themes — Dark Slate, Cyber Cyan, Solar Warmth, OLED Black and Aurora Teal — repaint a widget's background and accents. Weather glyphs and warning colours stay semantic. Free widgets keep following the weather. The pick is per widget, so the small one can run OLED while the big one follows the sky.
Lock Screen and Dynamic Island
Switch it on and a Live Activity keeps the current conditions on your Lock Screen and in the Dynamic Island. It shows temperature, condition, high/low, feels-like, rain chance, humidity, wind and AQI, refreshed through ActivityKit on each forecast update. It is opt-in, and ending it is the same switch.
Quick Settings tile
A tile in the notification shade shows the current temperature beside your Wi-Fi and Bluetooth toggles, and opens straight into the app.
Temperature in the status bar
A Kotlin method channel renders a live numeric temperature glyph directly into the Android status bar, from −40°F to 130°F. A persistent notification carries condition, rain chance, high/low and provider.
Told before you open it
Severe-weather push alerts fire on any newly active National Weather Service watch, warning or advisory, checked in the background — free, US coverage. Set a morning and an evening forecast briefing on your own schedule, composed from the latest fetch. Barometric-pressure health alerts, air-quality alerts and Grid Guard storm alerts are there for anyone who wants them, on Pro.
macOS Chrome & iPadOS Split Views
macOS and iPadOS get responsive two-pane dashboard layouts pairing live radar and forecast columns. The chrome is native too: window titlebars that clear the traffic lights, inset-grouped settings, and a macOS menu bar temperature item.
Standalone Radar Settings
Every radar option lives on one settings page, each explained in plain words. The weather layer, the four rain colour palettes, layer opacity, the map background, and the local tile cache with a one-tap clear.
2.0x Dynamic Type & VoiceOver
Hardened against 2.0x accessibility font scaling with responsive wrapping to eliminate overflow. VoiceOver and TalkBack read temperatures, wind and alerts as natural sentences, with full support for Reduce Motion, Bold Text and Increase Contrast.
No account needed, no profile
Location and preferences stay on the device. Forecasts come from public government open-data endpoints, so no sign-in is required and nothing is being assembled about you.
Out now
All of it, on your
phone today.
Sensecast is on Google Play and the App Store now, for Android, iPhone and iPad.
Runs on
- iOS & iPadOS 15+ — responsive multi-pane layout, lock screen widgets, Live Activities and Dynamic Island
- Android status bar glyph, Quick Settings tile and home widgets
- macOS native window chrome, multi-pane dashboard & menu bar temperature
- Web installable progressive web app